Students can access the CBSE Sample Papers for Class 11 Economics Education with Solutions and marking scheme Term 2 Set 1 will help students in understanding the difficulty level of the exam.
CBSE Sample Papers for Class 11 Economics Term 2 Set 1 with Solutions
Time : 2 Hours
Maximum Marks : 40
General Instructions:
- This is a subjective question paper containing 13 questions.
- This paper contains 5 questions of 2 marks each, 5 questions of 3 marks each and 3 questions of 5 marks each.
- Section A, 2 marks questions are Short Answer Type Questions-Answer them in 30-50 words.
- Section B, 3 marks questions are Short Answer Type Questions-Answer them in 50-80 words.
- Section C, 5 marks questions are Long Answer Type Questions-Answer them in 80-120 words.
- This question paper contains Case/Source Based Questions.
![]()
Section – A
(2 Marks Each)
Question 1.
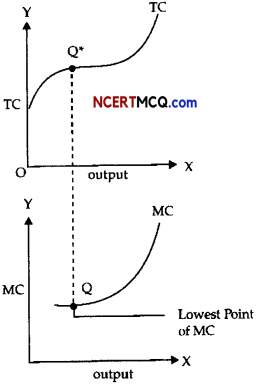
State the relationship between total cost and marginal cost.
OR
Comment on the shape of the MR curve in case the TR curve is a:
(i) Positively sloped straight line passing through the origin.
(ii) Horizontal line.
Answer:
(i) When MC is diminishing, TC increases at a diminishing rate.
(ii) When MC is rising, TC increases at an increasing rate.
(iii) When MC is constant, TC increases at a constant rate.
OR
(i) When TR curve is a positively sloped straight line passing through the origin, MR curve will be a horizontal straight line parallel to X-axis.
(ii) When TR curve is a horizontal line, MR curve will touch X-axis, i.e., MR will be zero (0), because addition to TR (which is MR) will be zero in this case.
Question 2.
What is the difference between price index and quantity index number?
Answer:
Price index measures the changes in the price level whereas quantity index measures the changes in the quantity level.
![]()
Question 3.
Explain tire implications of tire “freedom of entry and exit” feature of perfect competition.
OR
What is minimum price ceiling? Explain its implications?
Answer:
Under perfect competition, there will be no restriction on the entry and exit of both buyers and sellers. If the existing sellers start making abnormal profits, new sellers should be able to enter the market freely. This will bring down the abnormal profits to the normal level. Similarly, when losses will occur existing sellers may leave the market. However, such free entry or free exit is possible only in the long- run, but not in the short-run.
OR
For certain goods and services, government sets minimum price. This minimum price is called minimum price ceiling. This price is normally set at a level higher than the equilibrium price. This leads to excess supply. Since producers are not able to sell all they want to sell, they illegally sell the goods or services below the minimum price.
Question 4.
Define Standard Deviation. Write its two demerits.
OR
Name the different types of measures of dispersion.
Answer:
Standard deviation is the square root of the arithmetic mean of the squares of all deviations. Deviations are measured from arithmetic mean of the items.
Demerits:
- Difficult: The process of squaring the deviations and then to find the value of its square root is a time consuming process. It is quite difficult too.
- More important to extreme values: In calculation of standard deviation undue importance is given to marginal values.
![]()
OR
Measures of dispersion:
- Range,
- Coefficient of range,
- Inter quartile range,
- Quartile deviation,
- Mean deviation,
- Standard deviation, and
- Lorenz Curve.
Question 5.
Compute coefficient of correlation from the following data:
| X-Series | Y-Series | |
| Mean | 15 | 28 |
| Sum of squares of Deviation from Mean | 144 | 225 |
Sum of products of deviation of X and Y-series from their respective mean is 20. Number of pairs of observations is 10. (2)
Answer:
Given,
Σx2 = 144,
Σy2 = 225,
Σxy = 20,
N = 0
\(\begin{aligned}
r &=\frac{\Sigma x y}{\sqrt{\Sigma x^{2}} \sqrt{\Sigma y^{2}}} \\
&=\frac{20}{\sqrt{144 \times 225}} \\
&=\frac{20}{\sqrt{32,400}}=\frac{20}{180} \\
&=+0.11 .
\end{aligned}\)
![]()
Commonly Made Error
- Students usually forget the actual method of calculation of actual mean method.
Answering Tip
- Recall the Actual Mean Method of calculation of coefficient of correlation.
Section – B
(3 Marks)
Question 6.
Using the simple aggregative method, calculate the index number for the given data: (3)
| Commodity | A | B | C | D |
| P1 | 15 | 22 | 20 | 27 |
| P0 | 10 | 20 | 18 | 25 |
OR
Construct Index Number of price of 2011 from the following data by:
(i) Laspeyre’s Method
(ii) Paasche’s Method
| Commodity | 2001 | 2011 | ||
| Price | Quantity | Price | Quantity | |
| A | 10 | 30 | 12 | 35 |
| B | 9 | 10 | 11 | 15 |
| C | 8 | 15 | 10 | 20 |
| D | 6 | 20 | 7 | 25 |
Answer:
Construction of the index number:
| Commodity | p0 (base year) | p1 (current year) |
| A | 10 | 15 |
| B | 20 | 22 |
| C | 18 | 20 |
| D | 25 | 27 |
| Σp0 = 73 | Σp1 = 84 |
![]()
Formula :
\(p_{01}=\frac{\Sigma p_{1}}{\Sigma p_{0}} \times 100\)
⇒ p01 = \(\frac{84}{73}\) x 100 = 115.07
OR
Construction of Price Index Number:
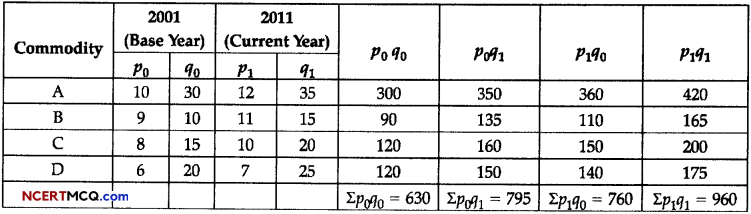
(i) Laspeyre’s Method:
p01 = \(\frac{\Sigma p_{1} q_{0}}{\Sigma p_{0} q_{0}}\) x 100
= \(\frac{760}{630}\) x 100 = 120.63
(ii) Paasche’s Method:
p01 = \(\frac{\sum p_{1} q_{1}}{\Sigma p_{0} q_{1}}\) x 100
= \(\frac{960}{795}\) x 100 = 120.75
Question 7.
Write the merits and demerits of scatter diagram. (3)
Read this passage below and answer Q. 8. and Q. that follow.
The slope of a total revenue curve is particularly important. It equals the change in the vertical axis (total revenue) divided by the change in the horizontal axis (quantity) between any two points. The slope measure the rate which total revenue increases as output increase. We can think of it as the increase in total revenue associated with a 1-unit increase in output. The increase in total revenue from a 1-unit increase in quantity is marginal revenue. Thus marginal revenue (MR) equals the slope of the total revenue curve. How much additional revenue does a radish producer gain from selling one more pound of radishes₹The answer, of course, is the market price of 1 pound. Marginal revenue equals the market price. Because the market price is not affected by the output choice of a single firm, the marginal revenue the firm gains by producing one more unit is always the market price. The marginal revenue curve shows the relationship between marginal revenue and the quantity a firm produces. For a perfectly competitive firm, the marginal revenue curve is a horizontal line at the market price. If the market price of a pound of radishes is $0.40, then the marginal revenue is $0.40. Marginal revenue curves for prices of $0.20, $0.40, and $0.60. In perfect competition, a firm’s marginal revenue curve is a horizontal line at the market price. Price also equals average revenue, which is total revenue divided by quantity. To obtain average revenue (AR), we divide total revenue by quantity, Q. Because total revenue equals price (P) times quantity (Q), dividing by quantity leaves us with a price.
Answer:
Merits of Scatter Diagram:
- It is simple and a non-mathematical method of studying correlation between two variables.
- It can be easily understood and interpreted.
- It is not influenced by the size of extreme values.
Demerits of Scatter Diagram:
- It is only a qualitative expression rather than a quantitative expression.
- It gives only a broad and rough idea of the degree and nature of correlation between two variables,
- This method does not indicate the exact numerical value of correlation.
![]()
Question 8.
What change will take place in marginal revenue when : 3
(i) Total Revenue increases at an increasing rate.
(ii) Total Revenue increases at a diminishing rate.
Answer:
- When total revenue increases at an increasing rate, marginal revenue should be increasing.
- When total revenue increases at a diminishing rate, marginal revenue should be diminishing.
Question 9.
Comment on the shape of the MR curve in case the TR curve is a: 3
- A positively sloped straight line passing through the origin.
- Horizontal line.
Answer:
- When TR curve is a positively sloped straight line passing through the origin, MR curve will be a horizontal straight line parallel to X-axis.
- When TR curve is a horizontal line, MR curve will touch X-axis, i.e., MR will be zero (0), because in addition to TR (Which is MR) will be zero in this case.
Question 10.
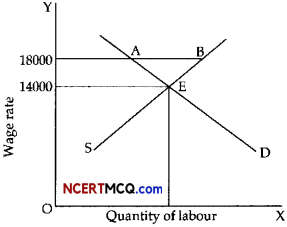
The equilibrium market wage rate is ₹14,000 per month. The government finding it low fixes minimum wage rate at ₹18,000 per month. Examine the implications of this decision. Use diagram. (3)
Answer:
Payment of wage rate (₹ 18,000) higher than equilibrium wage rate (₹ 14,000) leads to excess supply of labour as shown in the diagram, equal to AB. Since supply is greater than demand, it may lead to unemployment equal to AB.
![]()
Section – C
(5 Marks Each)
Question 11.
How is the price of a commodity determined in a perfectly competitive market? Explain with help of a diagram. (5)
Answer:
Price of a commodity is determined by market demand and market supply of a commodity i.e. industry is the price maker). An individual producer/firm has no role in the determination of the price of the commodity (firm is a price taker). No individual seller or buyer can influence the price of the commodity.
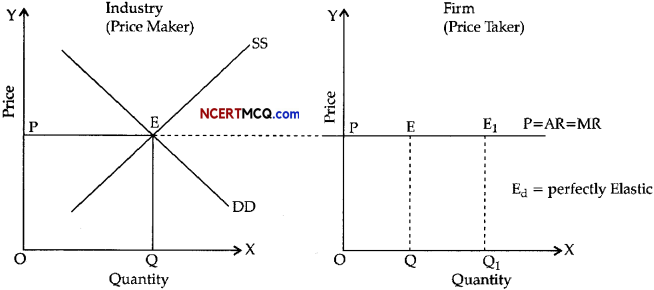
DD and SS are market demand and market supply curves intersecting at E. OQ quantity (Equilibrium Quantity) would be offered for sale and demanded by the buyers at OP price (equilibrium price) per unit. The industry is in equilibrium.
Commonly Made Error
- Students often write the perfectly competitive firm incorrectly.
Answering Tip
- Recall the price taking property of the perfectly competitive firm.
![]()
Question 12.
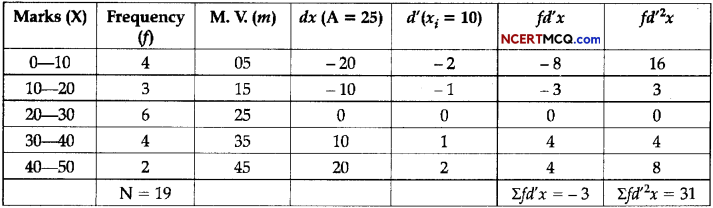
(a) Calculate the Standard Deviation from the following data by step deviation method. (3)
| Marks | No. of Students |
| 0-10 | 4 |
| 10-20 | 3 |
| 20-30 | 6 |
| 30-40 | 4 |
| 40-50 | 2 |
(b) Write four uses of consumer price Index. (2)
OR
(a) Calculate the quartile deviation for the following distribution. (5)

Answer:
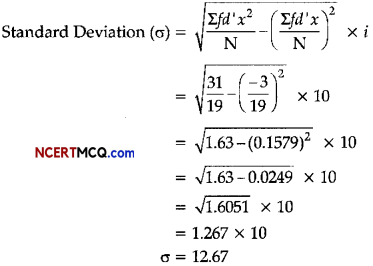
![]()
(b) Utility / Uses of Index Numbers:
- Index Numbers make easy the difficult facts: Index Numbers present the complex facts into simple and understandable form. So many times index number measures such changes which may not be measured directly.
- Index numbers make comparative study easy : Index Numbers show the facts represented in different units comparatively.
- Helpful in measuring irregular changes: For example changes in prices are helpful in different circumstances.
- Index Numbers studies the changes in general price level: Most important use of index number is that it measures the value of money during different periods of time.
OR
Calculation of cumulative frequency.
| Class | Frequency | Cumulative Frequency |
| 0-10 | 5 | 5 |
| 10-20 | 3 | 5 + 3 = 8 |
| 20-30 | 4 | 8 + 4 = 12 |
| 30-40 | 3 | 12 + 3 = 15 |
| 40-50 | 3 | 15 + 3 = 18 |
| 50-60 | 4 | 18 + 4 = 22 |
| 60-70 | 7 | 22 + 7 = 29 |
| 70-80 | 9 | 29 + 9 = 38 |
| 80-90 | 7 | 38 + 7 = 45 |
| 90-100 | 8 | 45 + 8 = 53 |
Here, N = 53
We know that,
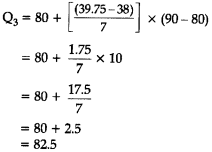
\(Q_{r}=l_{1}+\frac{r\left(\frac{\mathrm{N}}{4}-c\right)}{f}\left(l_{2}-l_{1}\right)\)
![]()
Finding Q1: r = 1
\(\frac{N}{4}=\frac{53}{4}\) = 13.25
Thus, Q1 lies in the interval 30 – 40.
In this case, quartile class = 30 – 40
l1 = lower limit of the quartile class
= 30
l2 = upper limit of the quartile class
= 40
f = frequency of the quartile class
= 3
c = cumulative frequency of the class preceding the quartile class
= 12
Now, by substituting these values in the formula we get:
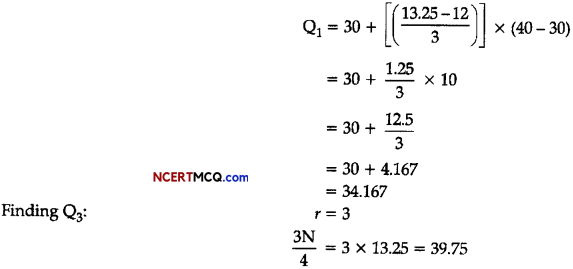
Thus, Q3 lies in the interval 80 – 90.
In this case,
![]()
quartile class = 80 – 90
l1 = lower limit of the quartile dass = 80
l2 = upper limit of the quartile class = 90
f = frequency of the quartile class = 7
c = cumulative frequency of the class preceding the quartile class = 38
Now, by substituting these values in the formula we get:
Finally, the quartile deviation
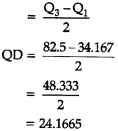
Hence, the quartile deviation of the given distribution is 24.167 (approximately).
Commonly Made Error
- Students often forget the formula of price-taking property.
Answering Tip
- Recall the formula for the price-taking property of the perfectly competitive firm.
![]()
Question 13.
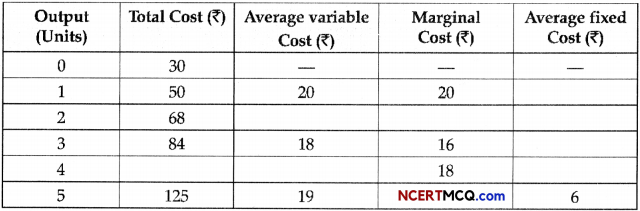
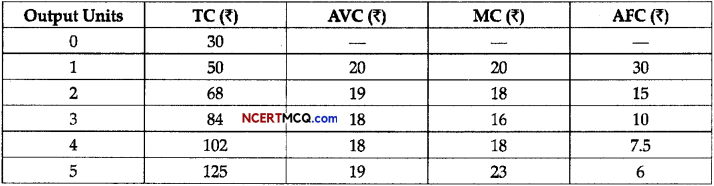
(a) Complete the following table : (2)
(b) Explain the law of variable proportion with the help of a diagram. (3)
Answer:
(a)
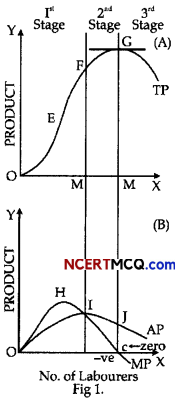
(b) The law of variable proportion states that as the quantity of factor increases while keeping the other factors constant the total product first increases with an increasing rate then increases with the decreasing rate and then diminishes.
Schedule-There are three stages of law of variable proportion.
- Stage I- Here, TP first increases with an increasing rate and MP and AP also increases up to a certain level. In the first phase there is better utilisation of fixed factor, increase in efficiency of variable factors and indivisibility of fixed factors.
- Stage II- Here, TP increases with the diminishing rate and MP and AP both starts to fall. The reasons responsible for the diminishing return of factors are optimum combination of factors and imperfect substitutes.
- Stage III- Here, TP reduces and MP becomes negative and AP is also falling but is positive. The factors responsible for negative returns to factor are limitation of fixed factors, poor coordination between variable and fixed factors, decreasing efficiency of variable factors.