CBSE Sample Papers for Class 12 Economics Paper 5 are part of CBSE Sample Papers for Class 12 Economics. Here we have given CBSE Sample Papers for Class 12 Economics Paper 5.
CBSE Sample Papers for Class 12 Economics Paper 5
| Board | CBSE |
| Class | XII |
| Subject | Economics |
| Sample Paper Set | Paper 5 |
| Category | CBSE Sample Papers |
Students who are going to appear for CBSE Class 12 Examinations are advised to practice the CBSE sample papers given here which is designed as per the latest Syllabus and marking scheme as prescribed by the CBSE is given here. Paper 5 of Solved CBSE Sample Paper for Class 12 Economics is given below with free PDF download solutions.
Time : 3 hrs
M.M.: 80
General Instructions
- All questions in both the sections A and B are compulsory. However, there is internal choice in questions of 3,4 and 6 marks.
- Question Nos. 1-4 and 13-16 are very short answer type questions, carrying 1 mark each.
They are required to be answered in one sentence each. - Question Nos. 5-6 and 17-18 are short answer I type questions, carrying 3 marks each.
Answers to them should not normally exceed 60 words each. - Question Nos. 7-9 and 19-21 are short answer II type questions, carrying 4 marks each.
Answers to them should not normally exceed 70 words each. - Question Nos. 10-12 and 22-24 are long answer type questions, carrying 6 marks each.
Answers to them should not normally exceed 100 words each. - Answers should be brief and to the point and the above word limit be adhered to as far as possible.
Section – A
Question 1.
What is meant by foregone cost in microeconomics?
Question 2.
The marginal revenue curve cuts the horizontal line between 7-axis and the demand curve into
(a) two unequal parts
(b) two equal parts
(c) Either (a) or (b)
(d) None of these
Question 3.
What is the relation between marginal cost and average cost when average cost is rising?
Question 4.
How production function establishes a technical relationship and not an economic relationship?
Question 5.
Price Elasticity of Demand (Ed) of a commodity is 2. If the quantity demanded increases by 1%, what is the percentage change in price?
Question 6.
State the conditions in which the production possibility curve can rotate outwards.
Or
Explain the major differences between the two branches of economics.
Question 7.
State the Law of Demand and the assumptions of Law of Demand.
Or
Discuss in brief the various kinds of demand.
Question 8.
The Price Elasticity of Supply s of good X is half of the Price Elasticity of Supply of good Y. A 10% rise in the price of good Y results in a rise in its supply from 400 units to 520 units. Calculate the percentage change in quantity supplied of good X when its price falls from ₹ 10 to ₹ 8 per unit.
Question 9.
Write any four points of difference between price making firm and price taking firm.
Question 10.
What do you understand by demand schedule and demand curve? Explain with the help of an example and a diagram.
Question 11.
State whether the following statements are true or false. Give reasons.
(i) When there are diminishing returns to a factor, Marginal Product and Total Product both diminishes.
(ii) When Marginal Revenue (MR) is positive and constant, Average Revenue (AR) and Total Revenue (TR) both will increase at constant rate.
(iii) As output is increased, the difference between Average Total Cost (ATC) and Average < Variable Cost (AVC) falls and ultimately becomes zero.
Or
State whether the following statements are true or false. Give reasons.
(i) As output increases, Average Cost (AC) tends to be closer to Average Variable Cost (AVC).
(ii) Average Cost (AC) is more consistent than Marginal Cost (MC).
(iii) When Marginal Revenue (MR) is zero, Average Revenue becomes maximum.
Question 12.
Maruti, Tata, Fiat, Ford and GM are only a few auto producers in .the Indian market. Identify the form of market in which they sell their products and also explain its features. If these companies decide to form a cartel, then will the consumer stand to benefit?
Section – B
Question 13.
Kuzira is a remote village in South Africa where people use animal skins to purchase goods. Which form of money is being used by them?
Question 14.
The estimated income receipts of the government in the budget of 2016 – 17 is ₹ 25,000 crore and its estimated expenditure is ₹ 27,500 crore. The budget of the government is
(a) balanced
(b) deficit
(c) surplus
(d) None of these
Question 15.
If borrowings and other liabilities are added to the budget deficit, we get
(a) fiscal deficit ,
(b) primary deficit
(c) capital deficit
(d) revenue deficit
Question 16.
Name the rate at which Central Bank gives loan to commercial banks for short-term.
Question 17.
Which of the following cannot have a negative value? Give reasons for your answer.
(i) Average propensity to save
(ii) Marginal propensity to save
Question 18.
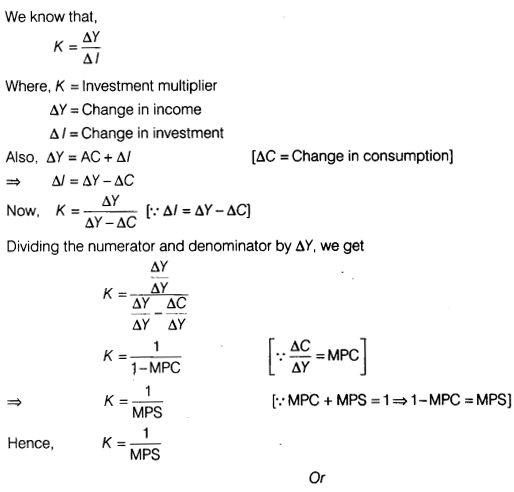
Derive the formula,
\(K=\frac { 1 }{ MPS } \)
where K = Investment multiplier
MPS = Marginal Propensity to save
Or
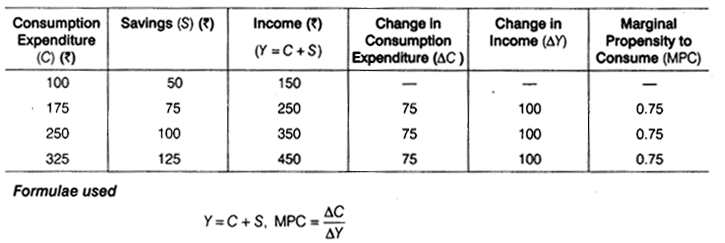
Complete the following table :
| Consumption Expenditure (₹) | Savings (₹) | Income (₹) | Marginal Propensity to Consume |
| 100 | 50 | 150 | — |
| 175 | 75 | — | — |
| 250 | 100 | — | — |
| 325 | 125 | — | — |
Question 19.
Identify the three phases of circular flow and identify the type of data that is required to measure National Income at each of the three phases of circular flow?
Question 20.
Anthony and Ajay were having a conversation on the topic of ‘money supply’. Anthony was of the view that since money supply consists of supply it is a flow concept, whereas Ajay was of the view that it is a stock concept. In your view, which of the two is correct? Why? Also explain the concept of money supply.
Or
Explain the following functions of the Central Bank.
(i) Bank of issue
(ii) Custodian of Foreign Exchange Reserves
Question 21.
Classify the following as revenue receipts and capital receipts. Justify your answer.
(i) Profit of public sector undertakings.
(ii) Market borrowing by the government.
(iii) Income from sale of its share in public sector undertakings.
(iv) Income from sale of spectrum.
Question 22.
Explain the steps taken in derivation of consumption curve from saving curve. Use diagram.
Or
Explain the steps taken in the derivation of saving curve from the consumption curve. Use diagram.
Question 23.
Calculate ‘Gross National Product at Factor Cost’ (GNPFC) from the following data by
(i) Income Method and
(ii) Expenditure Method.
| S.No. | Items | (₹) in crores |
| (i) | Private Final Consumption Expenditure | 1,000 |
| (ii) | Net Domestic Capital Formation | 200 |
| (iii) | Profits | 400 |
| (iv) | Compensation of Employees | 800 |
| (V) | Rent | 250 |
| (Vi) | Government Final Consumption Expenditure | 500 |
| (vii) | Consumption of Fixed Capital | 60 |
| (viii) | Interest | 150 |
| (ix) | Net Current Transfers from Rest of the World | (—) 80 |
| (x) | Net Factor Income from Abroad | (—) 10 |
| (xi) | Net Exports | (—) 20 |
| (xii) | Net Indirect Taxes | 80 |
Question 24.
Distinguish
(i) between autonomous and accommodating transactions of Balance of Payments account and
(ii) between current account and capital account.
Answers
Answer 1.
Forgone cost for a commodity is the amount of the other commodity that has been foregone in order to produce the first or in other words, it is the cost of next best opportunity foregone.
Answer 2.
(b) Two equal parts
Answer 3.
When average cost rises, the marginal cost also rises and it exceeds the average cost.
Answer 4.
Production function does not establish any economic relation between inputs and output. It only establishes a technical relation between inputs and output as it is only engineers (and not economists) who tells that ‘x’ variable factors with y fixed factors will produce a maximum of ‘z’ units of acommodity. Thus, production function connects inputs and output technically.
Answer 5.
Here, Price Elasticity of Demand (Ed) = 2
Percentage change in quantity demanded = 1%
Percentage change in price = ?
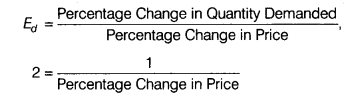
⇒ Percentage change in price = \(\frac { 1 }{ 2 } \) or 0.5%
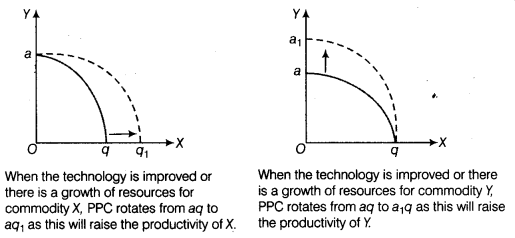
Answer 6.
The production possibility curve will rotate outward under the following two conditions:
(i) Improvement in technology in favour of one commodity.
(ii) Growth of resources for the production of one commodity.
Or
The two branches of economics are microeconomics and macroeconomics.
Difference between microeconomics and macroeconomics are :
| Basis | Microeconomics | Macroeconomics |
| Meaning | It is that branch of economics which studies individual economic variables like demand, supply, price, etc. | It is that branch of economics which studies aggregate economic variables like aggregate demand/supply, price level, etc. |
| Basic parameter | The basic parameter of microeconomics is price. | The basic parameter of macroeconomics is national income. |
| Scope | Since, it operates on individual level, it has a narrow scope. | Since, it operates with a high degree of aggregation, it has a very wide scope. |
Answer 7.
The Law of Demand states that other factors remaining constant, the demand for a commodity expands with fall in its price and contracts with rise in its price. In other words, Law of Demand states that there is an inverse relationship between the price of a commodity and its quantity demanded.
Assumptions of the Law of Demand are as follows:
- There should be no change in the price of substitute or complementary goods.
- There should be no change in the income of the consumer.
- There should be no change in the taste, preference and habit of the consumer.
- There should be no change in number of family members, government policy, etc.
- There should be no change in the distribution of income.
- No expectation of further changes in the availability of a commodity.
Or
The various kinds of demand are as follows:
- Price Demand It refers to the quantity demanded of a commodity in relation to its price, other things remaining unchanged, e.g. with decrease in price, demand for normal good rises.
- Income Demand It refers to the demand of a commodity in relation to income of the consumer, other things remaining constant, e.g. with increase in income, demand for normal good rises.
- Cross Demand It refers to the relationship between the price of a commodity and demand for related goods, other things being constant, e.g. with increase in price of one commodity (tea), demand for its substitute commodity (coffee) rises.
- Derived Demand When demand for one commodity is derived from demand for some other
commodity, then it is known as derived demand, e.g. demand for house leads to demand for cement, bricks, etc.
Answer 8.
Given, for good Y,
Initial Quantity (Q)=400 units; New Quantity (Q1) = 520 units
Change in Quantity (∆Q) = Q1 – Q = 520 – 400 = 120 units
Percentage Change in Quantity Supplied of \(Y=\frac { \triangle Q }{ Q } \times 100=\frac { 120 }{ 400 } \times 100=30\)%
Percentage Change in Price of Y =10% (given)
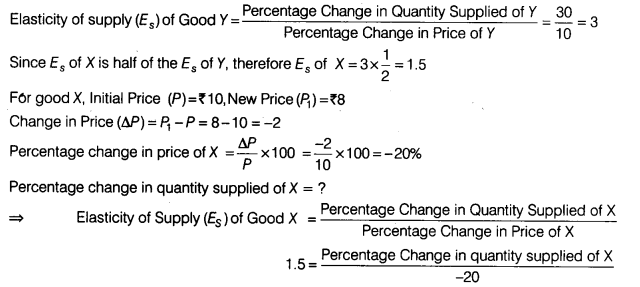
Percentage change in quantity supplied of X = 1.5 x -20 = -30
Therefore, supply of X falls by 30%.
Answer 9.
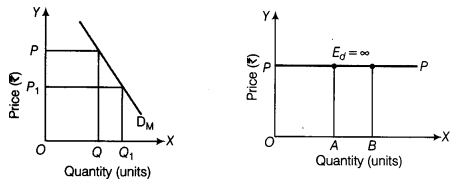
Difference between price making firm (monopoly) and price taking firm (perfect competition) are :
| Basis | Monopoly | Perfect Competition |
| Meaning | It refers to the market where there is a single seller or producer selling a particular good in the market. | It refers to the market where there are large number of sellers, selling homogeneous goods. |
| Degree of elasticity | Firm’s demand curve under monopoly is relatively less elastic. | Firm’s demand curve under perfect competition is perfectly elastic. |
| Slope of demand curve | Demand curve slopes downward with low elasticity and is steeper. | Demand curve is a horizontal straight line parallel to the X-axis. |
| Diagrammatic presentation | Demand curve for monopoly firm. | Demand curve for perfectly competitive firm. |
Answer 10.
Demand Schedule It is a table showing different quantities of goods that people are prepared to buy at different levels of price. In other words, the Law of Demand or demand function stated in a tabular form is termed as demand schedule.
Demand schedule can further be classified as follows:
(i) Individual Demand Schedule The schedule that shows the demand by an individual household for a commodity at different prices is known as individual demand schedule.
Example of individual demand schedule :
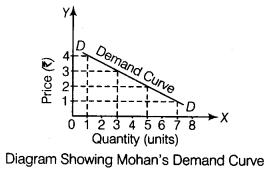
| Price of Milk (₹ per litre) | 4 | 3 | 2 | 1 |
| Mohan’s Demand for Milk (litre) | 2 | 3 | 5 | 8 |
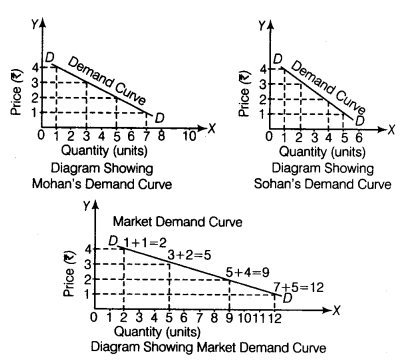
(ii) Market Demand Schedule The schedule that shows the demand of all the households for a commodity at different prices is known as market demand schedule.
Example of market demand schedule:
|
Price of Milk (₹ per litre) |
Mohan’s Demand for Milk (in litre) | Sohan’s Demand for Milk (in litre) | Market Demand for Milk (in litre) |
| 4 | 1 | 1 | 1+1 = 2 |
| 3 | 3 | 2 | 3+2 = 5 |
| 2 | 5 | 4 | 5+4 = 9 |
| 1 | 7 | 5 | 7+5 = 12 |
(Note It has been assumed that market consists of two households only)
Demand Curve A demand curve is the graphical representation of demand schedule showing the relationship between price of the commodity and its demand. It is a downward sloping curve.
Demand curve is of two types as given below:
(i) Individual Demand Curve A curve which shows the various quantities of a commodity demanded by a particular household at various levels of price is known as individual demand curve. It is the graphical representation of individual demand schedule.
(ii) Market Demand Curve Market demand curve is the horizontal summation of individual demand curve i.e. it is a curve which shows the various quantities of a commodity demanded by the whole market at various prices. It is the graphical representation of market demand schedule.
Answer 11.
- The statement is false.
When there are diminishing returns to a factor, Marginal Product diminishes but Total Product increases at a diminishing rate. - The statement is false.
When Marginal Revenue (MR) is positive and constant, Total Revenue (TR) increases at a constant rate. AR tends to be equal to MR. i.e. remain constant. - The statement is false.
As output increases, the difference between Average Total Cost
(ATC) and Average Variable Cost (AVC) falls but can never be zero. The difference is equal to Average Fixed Cost (AFC) which remains positive, even when it is falling.
Or
- The statement is true.
We know that AC = AFC + AVC. As output increases, AFC continuously fall, because TFC is constant. Consequently, the component of AFC in AC tends to shrink. This brings AC closer to AVC. - The statement is true. AC is more consistent because it is not directly affected by the law of variable proportion. On the other hand, MC is directly affected by law of variable proportion due to which it is narrow ‘IT shaped curve whereas, AC curve is wide ‘U’ shaped curve.
- The statement is false.
When Marginal Revenue is zero, Average Revenue will be diminishing.
Answer 12.
These cbmpanies sell their products in oligopoly market. Oligopoly is a form of market in which there are a few big sellers of a commodity and a large number of buyers.
Its main features are explained below ;
- A Few Firms A few firms, but large in size dominate the market for a commodity. Each firm commands a significant share of the market which can impact market price of the product.
- Large Number of Buyers There are a large number of buyers of a commodity. The number is so large that no individual buyer can impact market price of the product.
- Formation of Cartels With a view to avoid competition, firms may form a cartel. It is a formal agreement among the firms to avoid price competition.
- Non-price Competition Under oligopoly, firms tend to avoid price competition, e.g. in India, both Coke and Pepsi sell soft drink at the same price. However, in order to enhance its share of the market, each firm tries to resort to non-price competition.
If these companies form cartel, then this would lead to non-price competition and the consumer would be exploited.
Section – B
Answer 13.
The natives of Kuzira village are using commodity money.
Answer 14.
(b) Deficit
Answer 15.
(a) Fiscal deficit
Answer 16.
Repo rate is the rate at which Central Bank gives loan to the commercial banks for 1 to 14 days against approved securities.
Answer 17.
- Average Propensity to Save (APS) represents the ratio between savings and income. When consumption expenditure is more than income then it gives rise to negative savings or dis-savings. In this case, APS . will be negative.
- Marginal Propensity to Save (MPS) represents the ratio between change in savings and change in income. As such, its value cannot be negative. Its value ranges between 0 and 1. If the whole of income is spend on consumption, then MPS is zero. On the other hand, if whole of income is saved then MPS is one.
Answer 18.
Answer 19.
The three phases of circular flow of income are the production phase, the income phase and the expenditure phase.
The following data is required to measure national income at each of the three phases of circular flow :
- Production Phase The data relating to Net Value Added at Factor Cost in primary, secondary and tertiary sectors and Net Factor Income from Abroad.
- Income Phase The data relating to net interest, net rent, net profit and net wages and Net Factor Income from Abroad.
- Expenditure Phase The data relating to private consumption expenditure, government consumption
expenditure, gross domestic capital formation, net exports, depreciation, Net Indirect Taxes and Net Factor Income from Abroad.
Answer 20.
Ajay was correct, as supply of money is a stock concept. It refers to total stock of money held by the people of a country at a point of time.
Supply of money includes only that stock of money which is held by those who demand money and not those who supply money. Therefore, supply of money does not include:
- Stock of money held by the government.
- Stock of money held by.the banking system of a country.
It is because government and the banking system of a country are suppliers of money.
Or
- Bank of Issue The Central Bank of a country has the sole authority of issuing currency notes and coins in that country. All the currency issued by the Central Bank are unlimited legal tenders. No other commercial bank or financial institution can issue these currency notes except Central Bank. Flence, the Central Bank is also known as Bank of Issue. ‘
- Custodian of Foreign Exchange Reserves Central Bank is the custodian of nation’s foreign exchange reserve. The Central Bank maintains foreign exchange reserves in order to promote international trade and stabilise exchange rate to an agreed limit through managed floating.
Answer 21.
- Profit of public sector undertakings is a revenue receipt, because it neither creates liability nor reduces assets of government.
- Market borrowing by government is a capital receipt, because it creates a liability for the government in the form of borrowing from public.
- Receipt/Income from sale of its share in public sector undertaking is a capital receipt, as it causes reduction in assets of the government.
- Income from sale of spectrum is a non-tax source of revenue receipt, as it does not lead to reduction in assets and does not create liability for the government.
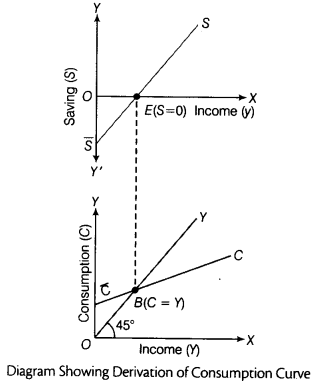
Answer 22.
Steps taken for derivation of consumption curve are:
- At zero level of income, the saving is OS which is the amount of autonomous consumption. So, OS = OC. Hence, the consumption will start from the point C.
- We draw a 45° line passing through the origin which shows that C = Y. This is the income line.
- Now we draw a vertical line from the point E, where saving is zero. At zero level of saving, C = Y, so B is the break-event point.
- The consumption curve is derived meeting C and B and extending it forward.
Or
Steps taken for derivation of saving curve are:
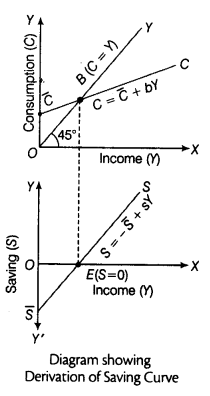
- At zero level of income (Y), the autonomous consumption is OC. If we take the vertical distance between the consumption curve, CC and income line at zero level of income, then OS =OC. Hence, the saving curve starts from the point S on the negative Y-axis.
- The consumption curve intersects income line at point B. B is the break-even point where consumption is equal to income (C = Y). At this point, saving will be zero as all the income is consumed. Hence, the saving curve will intersect the X-axis (at point E) at this income level.
- The consumption is less than income beyond point E. It means the excess income after consumption is saved and hence, the saving curve moves toward positive direction above X-axis with the increase in the level of income.
Answer 23.
(i) Income Method
Net Domestic Product at Factor Cost (NDPFC) = Compensation of Employees + Operating Surplus
(Profits + Rent + Interest) + Mixed Income
= 800 + (400 + 250 + 150) + 0 = 800 + 800
= ₹ 1,600 crore
Gross National Product at Factor Cost (GNPFC)
= NDPFC+Net Factor Income from Abroad + Depreciation
= 1,600 + (-10) + 60 = 1,660 -10 = ₹ 1,650 crore
(ii) Expenditure Method
Gross Domestic Product at Market Price (GDPMP)
= Private Final Consumption Expenditure + Government Final Consumption Expenditure + Gross Domestic Capital Formation + Net Exports
= 1,000 + 500 + (200 + 60) + (-20)
= 1,000 + 500 + 260 – 20 = ₹ 1,740 crore
Gross National Product at Factor Cost (GNPFC)= GDPMP – Net Indirect Taxes + Net Factor Income from Abroad (NFIA)
= 1,740 – 80 + (-10) = 1,740 – 90
= ₹ 1,650 crore
Answer 24.
(i) Difference between autonomous items and accommodating items of BoP are :
| Basis | Autonomous Items | Accommodating Items |
| Meaning | These items are related to those transactions which are determined by consideration of profit. | These items are not related to those transactions which are determined by consideration of profit. |
| Establish BoP identity | These items are not meant to establish BoP identity. | These items are meant to establish BoP identity. |
| Also called as | Above the line items. | Below the line items. |
(ii) Difference between current and capital account of BoP are:
| Basis | Current Account of BoP | Capital Account of BoP |
| Nature of transaction | These are the transactions which do not affect the assets or liabilities position of the country. | These are the transactions which affect assets or liabilities position of the country. |
| Concept | It is a flow concept. | It is a stock concept. |
| Formula/
Component |
Current Account = Exports and Imports of Visible and Invisible Items + Unilateral Transactions + Income Received- Income Paid to Abroad | Capital Account = Borrowings and Lending from and to Abroad + Investment to and from Abroad + Change in the Reserve of Foreign Exchange |
We hope the CBSE Sample Papers for Class 12 Economics Paper 5 help you. If you have any query regarding CBSE Sample Papers for Class 12 Economics Paper 5, drop a comment below and we will get back to you at the earliest.