Students can access the CBSE Sample Papers for Class 12 Economics with Solutions and marking scheme Term 2 Set 3 will help students in understanding the difficulty level of the exam.
CBSE Sample Papers for Class 12 Economics Term 2 Set 3 with Solutions
Time allowed: 2 Hours
Maximum Marks: 40
General Instructions:
- This is a Subjective Question Paper containing 13 questions.
- This paper contains 5 questions of 2 marks each, 5 questions of 3 marks each and 3 questions of 5 marks each.
- 2 marks questions are Short Answer Type Questions and are to be answered in 30-50 words.
- 3 marks questions are Short Answer Type Questions and are to be answered in 50-80 words.
- 5 marks questions are Long Answer Type Questions and are to be answered in 80-120 words.
- This question paper contains Case/Source Based Questions.
![]()
Question 1.
Distinguish between intermediate consumption and final consumption.
OR
Distinguish between domestic product and national product. (2)
Answer:
Intermediate Consumption refers to the expenditure incurred by a production unit on purchasing those goods and services from other production units which are meant for resale or for using up completely during the same year whereas Final consumption refers to the expenditure of those goods which are used either for consumption or for investment.
OR
Sum of the value of final products that take place within the domestic territory of a country is called domestic product, whereas the sum of contribution of residents of a country both within domestic territory or abroad is called national product.
Question 2.
If in an economy:
Change in initial investment (Δl) = ₹1,000 crores
Marginal propensity to save (MPS) = 0.2.
Find the value of the following:
(A) Investment multiplier (K)
(B) Change in final income (ΔY)
OR
Calculate change in final income, if Marginal Propensity to Consume (MPC) is 0 – 8 and change in initial investment is ₹1,000 crores. (2)
Answer:
(A) Investment multiplier (K) = 1/MPS
K = 10.2
K = 5
(B) Investment multiplier (K) = Δ Y/Δl
Substituting
K = 5
5 = ΔY/1000
ΔY = ₹5000 crores
OR
Investment Multiplier (K)
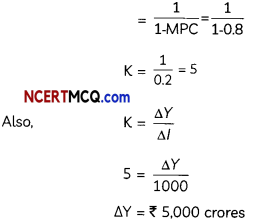
Change in final income = ₹5,000 crores
![]()
Question 3.
“An economy facing an unintended accumulation of inventories would try to reduce aggregate demand.’’ Do you agree with the given statement? Support your answer with valid reasons. (2)
Answer:
The given statement is not correct.
The situation of unintended accumulation of inventories arises when ex-ante aggregate demand is lesser than the ex-ante aggregate supply. This would pile up the stock with the producers, thus to tackle this situation the economy must increase aggregate demand (AD).
Question 4.
“Sustainable development is defined as an approach to developing or growing by using resources in a way that allows for them to renew or continue to exist for others.” In the light of this statement explain any one strategy of sustainable development. (2)
Answer:
Use of non-conventional sources of energy in India should be promoted. If we continue to depend upon the conventional sources like coal or petroleum products, we may end up with higher levels of pollution and an unsustainable environment. We should promote the use of non-conventional sources of energy like solar and wind power for a safer planet, to be passed on to the coming generations.
Question 5.
Discuss the need for on-the-job training for an employee.
OR
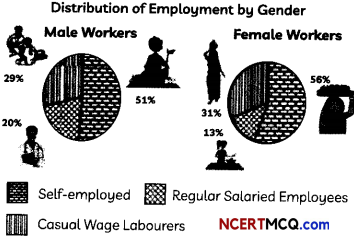
Analyze the distribution of employment by gender based in the following information:
Answer:
Employers use on-the-job training methods for its employees to target an overall increase in the skills and efficiencies of the workers. On-the-job training leads to an increase in productivity of labor and production of goods. Such training keep the employees updated with the latest changes in their field of working.
![]()
OR
Based on the given information, self-employment is a major source of livelihood for both men and women as this category accounts for more than 50 percent of the workforce in both diagrams. Casual wage work is the second major source for both men and women, a little more so for the latter (31 percent). When it comes to regular salaried employment, men are found to be so engaged in greater proportion. They form 20 percent whereas women form only 13 percent.
Question 6.
Giving reason state how are the following treated in estimation of national income.
(A) Payment of interest by an individual to a bank on a loan to buy a car.
(B) Expenditure by government on providing free educational services.
(C) Expenditure on purchasing a machine installed in a production unit.
OR
If in an economy the value of Net Factor Income from Abroad is ₹200 crores and the value of Factor Income to Abroad is ₹40 crores. Calculate the value of Factor Income from Abroad. (3)
Answer:
(A) Payment of interest to a bank by an individual is not included because the individual is a consumer.
(B) Expenditure by the government on free education is included because it is a final expenditure.
(C) Expenditure on machine installed in a production unit is included because it is an investment expenditure.
OR
Net Factor Income from Abroad = Factor Income from Abroad – Factor Income to Abroad ₹200 = Factor Income from Abroad – ₹40 Factor Income from Abroad = ₹200 + ₹40 = ₹240 crores
Question 7.
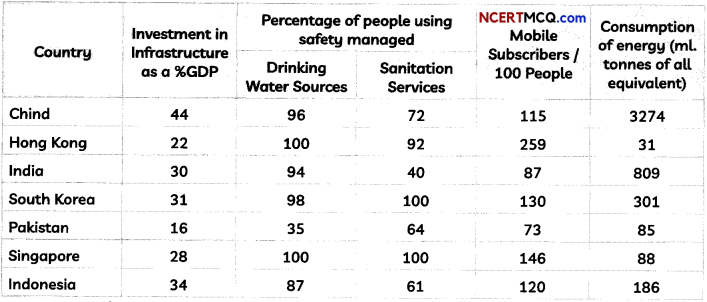
Study the following information and compare the Economies of India and Singapore on the grounds of ‘Investment in Infrastructure as a percentage of GDP’. (3)
![]()
Some Infrastructure in India and Other Countries, 2018
Sources: World Development Indicators 2019, World Bank website: www.worldbank.org.:
BP Statistical Review of World Energy 2019, 69th Edition
Note : (*) refers to Grass Capital Formation.
Read the following text carefully and answer questions number 8 and 9 given below:
India vs Pakistan: A tale of two economies
NEW DELHI : India and Pakistan – two of the biggest South Asian nations – started their economic journey around the same time after gaining Independence. Not many know that there was a point in the 1960s when Pakistan’s per capita GDP used to be higher than that of India’s. However, over the years, India has not only surpassed Pakistan’s per capita GDP but taken a commanding lead on almost every economic front.
Pakistan today is facing global criticism for failing to rein in homegrown terror groups even as it grapples with an ailing economy and mounting global debt. India, on the other hand, has become a global frontrunner which recently surpassed the UK to become the fifth-largest economy in the world. The stark economic contrast between the two neighbors shows that Pakistan’s unstable government, conflicting power centres, covert support to terror groups, and involvement in global terror strikes such as the 26/11 Mumbai attacks, have bled its economy.
From a higher per capita GDP of $83.33 in 1960, Pakistan’s today lags much behind India which witnessed a multi-fold raise its per capita GDP over the years. From 2007, India’s per capita GDP has consistently stayed higher than that of Pakistan’s. India is today the fastest-growing trillion-dollar economy in the world and the fifth-largest overall, according to data compiled by IMF’s World Economic Outlook.
It jumped from the 9th spot in 2010 to the 5th spot in a span of just 9 years. The GDP of India is almost 10 times that of Pakistan, which is placed at the 45th position.
![]()
India’s rise has been even more dramatic across the past couple of years. Since 2008, India’s GDP has risen almost 140 per cent as against an increase of about 63 percent for Pakistan.
https://timesofindia.indiatimes.com/ business/india-business/india-vs- pakistan-a-tale-of-two-economies/ articleshow/7945005 l.cms
Answer:
Though it is widely understood that infrastructure is the foundation of development, India is yet to wake up to the call. India invests only 30 percent of its GDP on infrastructure, which is far below that of China. So it can be concluded that India is investing in infrastructural facilities less than China and this gap is too large. Some economists have projected that India will become the third biggest economy in the world a few decades from now. Considering this fact, this is a relatively lower proportion in this direction. For that to happen, India will have to boost its infrastructure investment.
Question 8.
“India and Pakistan started their economic journey at the same time but now India is far ahead of Pakistan.” In the light of above statement, give any two reasons. (3)
Answer:
India is ahead of Pakistan as following have affected Pakistan’s economy:
(i) Unstable Government: In 1950, Pakistan’s per person GDP was US $1268, which was almost 50 per cent greater than India that year. However, in the backdrop of sustained political uncertainty and upheaval, Pakistan stagnated throughout the 1950s while a politically stable India grew. As a result, by 1960, India had almost caught up with Pakistan in per capita GDP terms with the per capita income gap having shrunk to 15 percent.
(ii) Homegrown Terror Groups or Ailing Economy: Pakistan’s economy has suffered a direct and indirect cost linked to terrorist activities of almost $126.79 billion, which is equal to ₹10762.14 billion. Pakistan today is facing global criticism for failing to rein in homegrown terror groups even as it grapples with an ailing economy and mounting global debt.
Question 9.
Compare and analyze India and Pakistan economies in the terms of GDP growth. (3)
Answer:
India has surpassed Pakistan’s per capita GDP over the years. From 2007, India’s per capita GDP has consistently stayed higher than that of Pakistan’s. India is today the fastest-growing trillion-dollar economy in the world and the fifth Largest overall, according to data compiled by IMF’s World Economic Outlook. It jumped from the 9th spot in 2010 to the 5th spot in a span of just 9 years. The GDP of India is almost 10 times that of Pakistan, which is pLaced at the 45th position. Since 2008, India’s GDP has risen almost 140 percent as against an increase of about 63 percent for Pakistan.
![]()
Question 10.
Suppose a ban is imposed on the consumption of tobacco. Examine its likely effects on:
(A) gross domestic product, and (B) welfare. (3)
Answer:
(A) Ban on the consumption of tobacco will bring down the production of tobacco. Since it is counted in GDP, GDP will fall.
(B) The ban will improve health in general. It will thus increase welfare.
Question 11.
“To boost the falling demand in the economy, Reserve Bank of India recently reduced Repo Rate and Reverse Repo Rate.” Elaborate the rationale behind the steps taken by the Central Bank. (5)
Answer:
The steps taken by the Central Bank to boost the falling demand in the economy are justified as the reduction in the Repo rate and Reverse Repo Rate will increase the availability of funds in the market through the commercial banks. Rationale: A decrease in Repo/Reverse Repo Rate will push the commercial banks to reduce the lending rate and will eventually make the borrowings cheaper for the general public. As a result, the consumption demand in the economy may increase.
Question 12.
(A) Define ‘net factor income from abroad’. How is it different from ‘net exports’?
(B) Calculate the value of “Rent” from the following data:
| Particulars | Amount (In ₹ crores) |
| Gross Domestic Capital Formation | 18,000 |
| Mixed-Income of Self Employed | 7,000 |
| Subsidies | 250 |
| Interest | 800 |
| Rent | ? |
| Profit | 975 |
| Compensation of Employees | 6,000 |
| Consumption of Fixed Capital | 1,000 |
| Indirect Tax | 2,000 |
![]()
OR
(A) State any two precautions that must be taken into consideration while estimating national income by the value-added method. (5)
(B) In an economy, the following transactions took place. Calculate the value of output and value-added by Firm B: i. Firm A sold to firm B goods of 80 crores; to firm C 50 crore; to househoLd 30 crore and goods of vaLue, 10 crore remains unsold ii. Firm B sold to firm C goods of 70 crores; to firm D 40 crore; goods of vaLue 30 crores were exported and goods of value 5 crores were sold to the government. (5)
Answer:
(A) Net Factor Income from Abroad is the excess of factor incomes (rent, wages, interest, profit) earned from abroad over factor incomes (rent, wages, interest, profit) paid to abroad, whereas; net export refers to the excess of the value of exports over the value of imports of a country in an accounting year.
(B) GDPMP = NDPFC + Depreciation + Net indirect tax
(i) = (vii) + (ii)+ [(iv) + (vi) + Rent] + (viii) + [(ix)-(iii)]
18000 = (6000 + 7000 + (800 + 975 + Rent) + 1000 + (2000 – 250) 18000
= 17525 + Rent Rent
= ₹ 475 crore
OR
(A) Precautions of value added method are:
- Value of sale and purchase of second hand goods is not considered while estimating value added as the value of second hand goods is already accounted during the year they were produced.
- Value of intermediate goods is not included in the estimation of value added because value of intermediate goods is reflected in the value of final goods.
(B) Value of output of firm B = Sales of firm B to firm C + Sales of firm B to firm D + Exports + Sales of firm B to Government = 70 + 40 + 30 + 5 = 145 crores Value Added by Firm B = Value of output by Firm B – Purchases by Firm B from firm A = 145 – 80 = 65 crores
Question 13.
(A) “If the rate of resource extraction exceeds the rate of regeneration, it leads to a reduction in carrying capacity of the environment.” Discuss the rationale of the given statement with valid reasons.
(B) Over 60% of India’s arable and is estimated to suffer from environmental degradation. This has been caused by both by a rapidly growing poor population seeking subsistence and by the misappropriation of natural resources by the wealthy for Luxury consumption. In the Light of these Unes, state and discuss any two principaL causes of environmental degradation. (5)
Answer:
(A) The environment is able to perform its functions uninterruptedly so long as the demand for these functions is within the carrying capacity of the environment. This means that the resources are not extracted beyond the rate of their regeneration. If there is a disequilibrium (demand being more than supply), the environment fails to replenish itself and it will lead to environmental crisis. Thus, to maintain a healthy environment, the carrying capacity of the environment must be valued and respected.
![]()
(B) Two principal causes behind environmental degradation:
- Population Rise: Rising population is one of the major causes for degradation of the environment as it adds to the burden on natural resources, leading to environmental crisis.
- Consumption Levels: It has been observed that the developing and developed nations have witnessed affluent consumption levels in the past, bringing disequilibrium in the demand and supply of the natural resources, pushing the world to the threshold of the environmental crisis.