Students can access the CBSE Sample Papers for Class 12 Economics with Solutions and marking scheme Term 2 Set 9 will help students in understanding the difficulty level of the exam.
CBSE Sample Papers for Class 12 Economics Term 2 Set 9 with Solutions
Time allowed: 2 Hours
Maximum Marks: 40
General Instructions:
- This is a Subjective Question Paper containing 13 questions.
- This paper contains 5 questions of 2 marks each, 5 questions of 3 marks each and 3 questions of 5 marks each.
- 2 marks questions are Short Answer Type Questions and are to be answered in 30-50 words.
- 3 marks questions are Short Answer Type Questions and are to be answered in 50-80 words.
- 5 marks questions are Long Answer Type Questions and are to be answered in 80-120 words.
- This question paper contains Case/Source Based Questions.
![]()
Question 1.
What happens to aggregate income in an economy in which intended saving exceeds intended investment?
OR
If in an economy investment is greater than saving, what is the effect on the national income? (2)
Answer:
Aggregate income will tend to fall when intended saving exceeds intended.
OR
If in an economy investment is greater than saving, the level of income will rise till full employment is achieved.
Question 2.
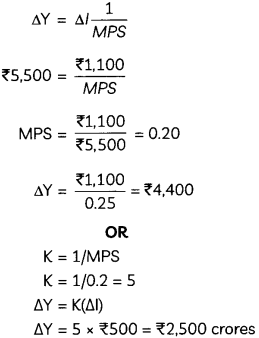
In an economy, investment increased by ₹1,100 and as a result of it, income increased by ₹5,500. Had the marginal propensity to save been 25 percent, what would have been the increase in income?
OR
If in an economy:
Change in initial Investments (Δl) = ₹500 crores
Marginal Propensity to Save (MPS) = 0.2
Find the values of the following:
(A) Investment multiplier (K)
(B) Change in final income (ΔY) (2)
Answer:
![]()
Question 3.
“GLF campaign met with many problems.” Elucidate. (2)
Answer:
GLF campaign met with many problems. A severe drought caused havoc in China killing about 30 million people. When Russia had conflicts with China, it withdrew its professionals who had earlier been sent to China to help in the industrialisation process.
Question 4.
“India has always had an advantage over Pakistan in some areas”. State any two such areas. (2)
Answer:
India has always had an advantage over Pakistan in some areas, such as
- having more trained labor
- making good investments in education
- improving basic health care facilities (Any two)
Question 5.
What was the aim of implementing Great Leap Forward campaign in China?
OR
Compare and analyze Indian and Chinese economy on the basis of below-given table:
Annual Growth of Gross Domestic Product (%), 1980 – 2017
| Country | 1980 – 90 | 2015 – 2017 |
| India | 5.7 | 7.3 |
| China | 10.3 | 6.8 |
Answer:
The main aim of’Great Leap Forward’ (GLF) in China was to ensure rapid increase of industries. The campaign is modeled on the development of major industries in the country. People were motivated about establishing industries in their backyards.
OR
When many developed countries were finding it difficult to maintain a growth rate of even 5 percent, China was able to maintain near double-digit growth during 1980s. In 2015 – 17, there has been a decline in China’s growth rate, whereas, India met with a moderate increase in growth rate.
![]()
Question 6.
Will the following be included in the national income of India? Give reasons for your answer.
(A) Financial assistance to flood victims.
(B) Profits earned by the branches of a foreign bank in India.
(C) Salaries of Indians working in the American Embassy in India.
OR
If the Real Gross Domestic Product is Rs. 250 and the price Index (base = 100) is 120, calculate the Nominal Gross Domestic Product. (3)
Answer:
(A) No. Financial assistance to flood victims are
not included as it is a transfer payment.
(B) No. It is a factor income to abroad.
(C) Yes. Included as it is a factor income from abroad so it is added to NDP to get Nl.
OR
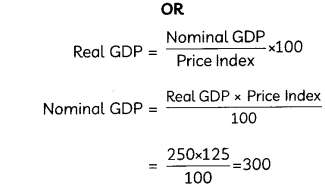
Nominal Gross Domestic Product = ₹300
Question 7.
The following table shows distribution of workforce in India for the year 1972 – 73. Analyse it and give reasons for the nature of workforce distribution. You will notice that the data is pertaining to the situation in India 30 years ago.
| Place of Residence | Workforce (in millions) | Total | |
| Male | Female | ||
| Rural | 125 | 70 | 195 |
| Urban | 32 | 7 | 39 |
Read the following case carefully and answer question number 8 and 9 given below:
India’s ambition of sustaining its relatively high growth depends on one important factor: infrastructure. The country, however, is plagued with a weak infrastructure incapable of meeting the needs of a growing economy and growing population. S&P Global Ratings projects India’s GDP to grow around 8% for the next three fiscal years, among the fastest in large, growing economies. The government also aims to significantly boost the manufacturing sector to contribute an all-time high of about 25% of GDP by 2025, from below 16% currently.
![]()
India is striving to improve its manufacturing competitiveness at a time when manufacturing powerhouse China is shifting toward consumption-led growth. China now faces the risk of overcapacity in segments such as port and power. For India, on the other hand, its road to sustainably higher growth and a competitive manufacturing sector goes through robust and reliable national infrastructure, especially in power and transportation.
Answer:
In 1972-73:
(A) Pre dominance of agriculture as out of total workforce of 234 million, 195 million was in rural areas and only 39 million in urban areas.
(B) More male workers both in urban and rural areas as only 77 million female workers were there as compared to 157 million male workers.
(C) Less female workers in both rural and urban areas. Also, female workers were much lesser in urban areas. In rural areas, males accounted for 125 million workforce and women 70 million of work force. In urban areas, 32 million males formed the workforce whereas women workforce was only 7 million.
Question 8.
“Infrastructure is often called as the lifeline of the economy.” Explain in the context of above case. (3)
Answer:
Infrastructure is often called as the lifeline ofthe economy. Infrastructure provides supporting services in the main areas of industrial and agricultural production, domestic and foreign trade and commerce. It helps in increasing the productivity of the factors of production and enhancing the quality of life. Infrastructure is also critical for achieving manufacturing competitiveness.
![]()
Question 9.
“Infrastructural facilities are mainly built or run by the government and public sector enterprises.” Defend or refute the statement with valid reason? (3)
Answer:
Building of infrastructure requires Large and lumpy investment and has a relatively long gestation period. Due to this fact, infrastructural facilities are either built or run by the government and public sector enterprises and if private sector is permitted to make investments and run infrastructural projects, they must be regulated in order to ensure quality infrastructure to one and all in the society.
Question 10.
Do you think that in the last 50 years, employment generated in the country is commensurate with the growth of GDP in India? How? (3)
Answer:
During the period 1950-2010, the Gross Domestic Product (GDP) of India grew positively and was higher than the employment growth. However, there was always a fluctuation in the growth of GDP. During this period, employment grew at the rate of not more than 2 percent.
In the late 1990s: employment growth started declining and reached the level of growth that India had in the early stages of planning. During these years, we also find a widening gap between the growth of GDP and employment. This means that in the Indian economy, without generating employment, we have been able to produce more goods and services. This refers as jobless growth.
![]()
Question 11.
Given the following data, find the missing value of ‘Government Final Consumption Expenditure’ and ‘Mixed-Income of Self Employed’.
| Particulars | Amount (in ₹ crores) |
| National Income | 71,000 |
| Gross Domestic Capital Formation | 10,000 |
| Government Final Consumption Expenditure | ? |
| Mixed-Income of Self-Employed | 7 |
| Net Factor Income from Abroad | 1,000 |
| Net Indirect Taxes | 2,000 |
| Profit | 1,200 |
| Wages and Salaries | 15,000 |
| Net Exports | 5,000 |
| Private Final Consumption Expenditure | 40,000 |
| ! Consumption of Fixed Capital | 3,000 |
| Operating Surplus | 30,000 |
Given the following data, find the values of ‘Operating Surplus’ and ‘Net Exports’:
| Particulars | Amount (in ₹ crores) |
| Wages and Salaries | 2,400 |
| National Income | 4,200 |
| Net Exports | ? |
| Net Factor Income from Abroad | 200 |
| Gross Domestic Capital Formation | 1,100 |
| Mixed-Income of Self-Employed | 400 |
| Private Final Consumption Expenditure | 2,000 |
| Net Indirect Taxes | 150 |
| Operating Surplus | ? |
| Government Final Consumption Expenditure | 1,000 |
| Consumption of Fixed Capital | 100 |
| Profits | 600 |
Answer:
Mixed income of self-employed = (i) – [(viii) + (xii) + (v)]
= 71,000 – (15,000 + 30,000 + 1,000)
Mixed income of self-employed = ₹25,000 crores
Government Final consumption expenditure = (D – [(x) + (ii) + (v) + (ix)] + (vi) + (xi)
= 71,000 – (40,000 + 10,000 + 1,000 + 5,000) + 2,000 + 3,000
= ₹20,000 crores
OR
Operating surplus = (ii) – (iv) – (vi) – (i)
= 4200 – 200 – 400 – 2400 = 1200 crores
Net exports = (ii) – (vii) – (x) – (v) + (xi) + (viii) – (iv)
= 4200 – 2000 – 1000 – 1100 + 100 + 150 – 200
= ₹150 crores
![]()
Question 12.
(A) How does increase in inequalities in distribution of income affect welfare of the society? Explain.
(B) “Higher Gross Domestic Product (GDP) means greater per capita availability of goods in the economy.” Do you agree with the given statement? Give valid reason in support of your answer. (5)
Answer:
(A) Increase in inequalities means that rich become richer and poor become poorer. Since utility of money is higher among poor and Lower among the rich, any increase in inequalities may not lead to increase in welfare.
(B) “Higher Gross Domestic Product (GDP) means greater per capita availability of goods in the economy.” This statement is not true.
- If the rate of population growth is more than the rate of growth of GDP, the per capita availability of goods and services will fall.
- GDP doesn’t account for changes in inequalities in distribution of Income. If the rising GDP is concentrated in a few hands, per capita availability of goods in the economy might not increase.
Question 13.
Explain determination of equilibrium level of national income using aggregate demand and aggregate supply approach. Use diagram. Also explain the effect when aggregate demand is less than aggregate supply. (5)
Answer:
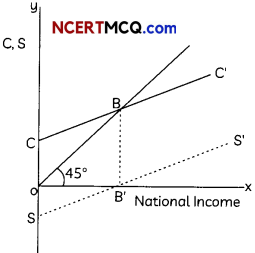
The equilibrium is where AD = AS i.e. at point E where AD curve intersects the 450 line. OM is the equilibrium income.
![]()
When AD is less than AS, inventories accumulate. The producers produce less. This continues till AS falls enough to be equal to AD.