 On this page, you will find Data Handling Class 7 Notes Maths Chapter 3 Pdf free download. CBSE NCERT Class 7 Maths Notes Chapter 3 Data Handling will seemingly help them to revise the important concepts in less time.
CBSE Class 7 Maths Chapter 3 Notes Data Handling
Data Handling Class 7 Notes Conceptual Facts
1. Data: The collection of informations in the form of numerical figures is called data.
Each number in a data is called observation or variate and number of times a particular observation occurs is called its frequency.
2. Range: The difference between the highest and the lowest observation in a given data is called ‘Range’.
3. Frequency distribution table: A table representing the frequency of various observations is called frequency distribution table.
4. Mean, Average or Arithmetic Mean:
\(\text { Mean }=\frac{\text { Sum of all observations }}{\text { Number of observations }}=\frac{\Sigma x_{i}}{\Sigma f_{i}}\) where i=1,2,3,…………
Mean of grouped data \(=\frac{\Sigma f_{i} x_{i}}{\Sigma f_{i}}\) i=1,2,3,…………
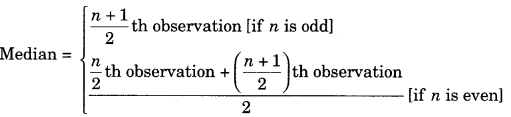
5. Median: When the observations are arranged in ascending or descending order, then the middle observation is called its Median.
6. Mode: The observation which occurs maximum number of times in a given data is called its ‘mode’. Mean, median
and mode are called measures of central tendency.
7. Bar graph: The representation of data in the form of bars of uniform width is called bar graph.
8. A double bar graph is used to compare the information related to two types of data.
9. Probability is a chance of happening and not happening and event.
10. The probability of an event which is certain to happen is 1. It is also called as ‘sure event’.
11. The probability of an event which is impossible to happen is 0. It is also called as ‘impossible event’.