Here we are providing Class 12 Geography Important Extra Questions and Answers Chapter 1 Data: Its Source and Compilation. Geography Class 12 Important Questions are the best resource for students which helps in class 12 board exams.
Class 12 Geography Chapter 1 Important Extra Questions Data: Its Source and Compilation
Data: Its Source and Compilation Important Extra Questions Short Answer Type
Question 1.
What are Geographic Data ?
Answer:
Geographic data constitute a set of information. It gives distribution and density of a phenomenon. There are many types of data. Since Geography deals with both natural and human phenomena, geographic data range from rocks of the earth surface to climate, crops, industries, animals and humans and all the attributes of each of them. Geographic data can be both qualitative or quantitative.
Question 2.
What are the main steps involved in data classification ?
Answer:
Data classification involves the following main steps :
- Classifying data on the basis of time, region, quality, magnitude, etc.
- Tabulating the data in the form of tables, without losing their accuracy.
- Processing the data using suitable statistical techniques.
Question 3.
Describe the primary and secondary sources of data.
Answer:
Sources of Data: There are two main sources of geographic data: primary and secondary.
(i) Primary Data : Data collected directly from the field by counting a phenomena or interviewing people is called primary data. The main source of primary data is field investigation.
(ii) Secondary data : is not collected by the user directly, it is already published or available with some reliable sources. The user uses the data and derives his conclusions taking them as authentic.
Question 4.
What are the sources of data ?
Answer:
The main source of primary data is field investigation. There are numerous sources of secondary information. Each specialised agency gathers and publishes its own relevant data.
- Census of India publishes population data
- Agriculture department publishes agricultural data.
- Water Resource department publishes water-related data.
- In India maps are published by Survey of India (SOI) and National Atlas and Thematic Mapping Organization (NATMO). Survey of India publishes topographical maps on various scale while NATMO publishes thematic maps.
Question 5.
What is the importance of Diagrammatic representation of data ?
Answer:
Diagrammatic representation of data is another important characteristic of Geography. One can convert a huge table of data into graphs, charts, pie diagrams or maps and present its salient features visually. Such maps give visual representation of the distribution of selected phenomena or a set of phenomena in relation to each other.
Question 6.
Describe the main steps of data analysis.
Answer:
Data Analysis — Main Steps :
(1) Collection of Data is the first step in its utilisation. Care is taken to record data as accurately as possible. Because defective data leads to defective results.
(2) Data Classification involves editing, classification and organisation of the collected data to present the same in condensed forms. The sum total of computing, tabulating and statistically transforming relevant information in a suitable format is known as data analysis. The first step in this process is classification of the data according to some common characteristics.
Question 7.
What is meant by tabulation of data ?
Answer:
Tabulation of Data. The raw data is collected in an unclassified form. It is difficult to understand it and draw a conclusion from it. This data is presented in a systematic and arranged form. The principle method of presenting data is through tabular representation.
The purpose of a table is to simplify the presentation and to make comparisons easy. The data is presented in the shape of columns and rows. Columns are drawn vertically and the rows are drawn horizontally.
Main parts of a table. The main functional parts of a table are shown in the following format:
- Table number. Table number is given for reference.
- Title of the table. Title of the table is written to describe the contents of the table.
- Head note. The head note gives detailed information of the data.
- Sub-title. The sub-title includes sub-head and entries.
- Body. It includes the data entries in cells.
- Box-head. The box-head labels the data written in the columns.
- Footnote. Some information is placed at the bottom of the table and is marked with (*).
- Source note. The source of data is given at the bottom of the table.
Table Number —Title of the Table —Head-note
| Sub-head | Master Caption | Box Head | ||
| Column Head | Column Head | Column Head | ||
| Sub-entries | Cell Cell Cell |
Cell Cell Cell |
Cell Cell |
Body |
Footnotes if, any; Sources
Question 8.
What do you mean by classification of data ? How is data classified ?
Answer:
Classification of data. The data is classified in different groups. It makes the data understandable. Classification is a process of arranging data into groups according to their common characteristics and putting them into different classes on the basis of their values. The data is arranged either in ascending order or descending order.
Example. Arrange the following data of marks obtained by some students, in ascending and descending order:
67 34 36 48 49 31 61 34 43 45 38 32 28 61 29 47 36 50 46 30 46 32 40 33 45 49 48 41 53 36 37 47 47 30 46 50 28 35 35 38 46 40 34 36 62 69 56 28 44 43 60
39.
Ascending order
28, 28, 28, 29, 30, 30, 30, 31, 32, 32, 33, 34, 34, 34, 35, 35, 36, 36, 36, 36, 37, 38, 38, 38, 41, 43, 43, 43, 44, 45, 45, 46, 46, 46, 46, 47, 47, 47, 48, 48, 49, 49, 50, 50, 50, 53, 60, 61, 61, 62, 67, 69.
Descending order
69, 67, 62, 61, 61, 60, 53, 50, 50, 50, 49, 49, 48, 48, 47, 47, 47, 46, 46, 46, 46, 45, 45, 44, 43, 43, 43, 41, 39, 38, 38, 37, 36, 36, 36, 36, 35, 35, 34, 34, 34, 33, 32, 32, 31, 30, 30, 30,
29, 28, 28, 28.
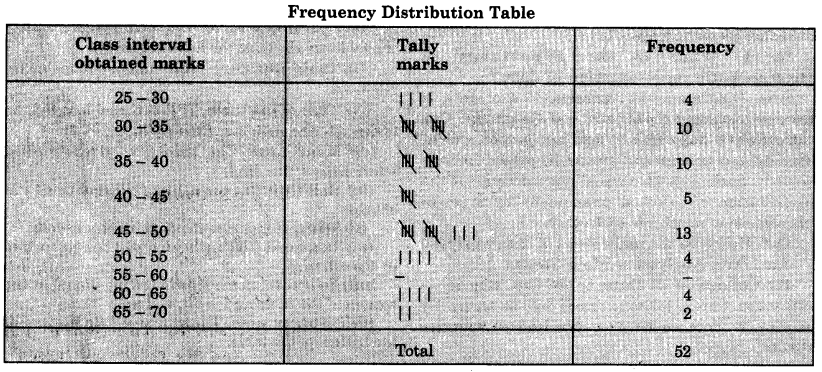
Frequency Distribution Table
Frequency Distribution Table is a summary table in which data is arranged in a compact and systematic form. The whole range of values is divided into different groups or classes. These values are shown by Tally Bars. The values are shown by vertical lines. Four lines are drawn as vertical lines and is crossed obliquely by the fifth line.
It is known as Tally Bar which shows value of five. When these Tally Bars are counted and written in numerical value, it is called frequency. The difference between the highest value and the lowest value is called Range. The difference between the lower limit and upper limit of a class is known as class interval.
Question 9.
Describe the different methods of classification of data.
Answer:
Methods of Classification. Data classification makes the complex data easy to understand and make conclusions. Data is grouped according to different variables.
(i) Simple Frequencies. When the data is classified on the basis of an element of geographical facts, such as population density state wise, it is expresed as f (The number) 2 f = N = Total.
(ii) Temporal Classification. When data is presented according to time. As population in 1951¬60, 1961-70, etc.
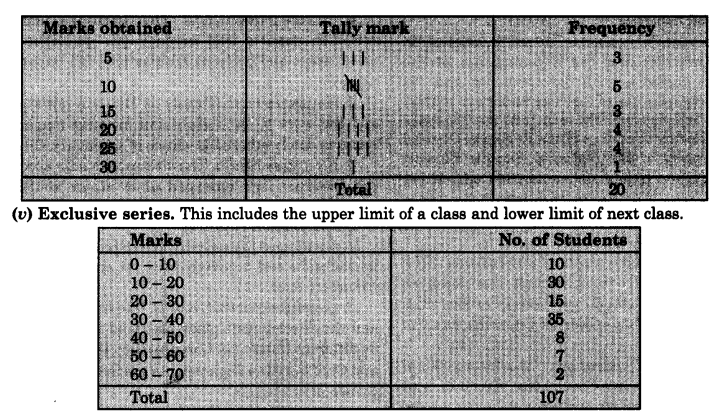
(iii) Individual Series. When each element is shown by different measure-marks of students.
Roll No. 1 2 3 4 5 6 ‘7 8 9 10 11 12 13 14 15 16 17 18 19 20
Marks 15 10 20 5 15 20 5 10 20 25 30 25 10 15 25 10 5 20 25 10.
(iv) Discrete series. This series shows definite measure of each unit.

Question 10.
Describe the primary and secondary sources of data.
Answer:
Sources of Data. The data are collected through the following ways. These are :
1. Primary sources, and
2. Secondary sources.
The data which are collected for the first time by an individual or a group of individuals, institution/ organisations are called Primary sources of the data. On the other hand, data collected from any published or unpublished sources are called Secondary sources.
Sources of Primay Data
1. Personal Observations. It refers to the collection of information by an individual or group of individuals through direct observations in the field.
2. Interview. In this method, the researcher gets direct information from the respondent through dialogues and conversations.
3. Other Methods. The data about the properties of soil and water are collected directly in the field by measuring their characteristics using soil kit and water quality kit. Similarly, field scientists collect data about the health of the crops and vegetation using transducers.
Secondary sources of data
Secondary sources of data consist of published and unpublished records which include government publications, documents and reports.
Published Sources
1. Government Publications. The publications of the various ministries and the departments of the Government of India, state governments and the District Bulletins are one of the most important sources of secondary information.
These include the Census of India published by the Office of the Registrar General of India, reports of the National Sample Survey, Weather Reports of Indian Meteorological Department, and Statistical Abstracts published by state governments, and the periodical reports published by different commissions.
2. Semi/Quasi-goverment Publications. The publications and reports of Urban Development Authorities and Municipal Corporations of various cities and towns, Zila Parishads (District Councils), etc., fall under this category.
3. International Publications. The international publications comprise yearbooks, reports and monographs published by different agencies of the United Nations such as United Nations Educational, Scientific and Cultural Organisation (UNESCO), United Nations Development Programme (UNDP), World Health Organisation (WHO), Food and Agricultural Organisation (FAO), etc.
4. Private Publications. The yearbooks, surveys, research reports and monographs published by newspapers and private organisations fall under this category.
5. Newspapers and Magazines. The daily newspapers and the weekly, fortnightly and monthly magazines serve as easily accessible source of secondary data.
6. Electronic Media. The electronic media specially the Internet has emerged as a major source of secondary data in recent times.
Unpublished Sources
1. Goverment Documents. The unpublished reports, monographs and documents are yet another source of secondary data.
2. Quasi-government records. The periodical reports and the development plans prepared and maintained by different Municipal Corporations, District Councils and Civil Services departments are included in Quasi¬government records.
3. Private Documents. These include unpublished reports and records of companies, trade unions, different political and apolitical organisations and resident welfare associations.