Here we are providing Class 12 Geography Important Extra Questions and Answers Chapter 2 Data Processing. Geography Class 12 Important Questions are the best resource for students which helps in class 12 board exams.
Class 12 Geography Chapter 2 Important Extra Questions Data Processing
Data Processing Important Extra Questions Short Answer Type
Question 1.
What do you mean by ‘Measures of central tendency’ ?
Answer:
“Measures of Central Tendency is an important technique for statistical analysis. Sometimes, it becomes necessary to obtain a single representative value for the entire data. This value enables one to make comparisons between different types of data. As these figures are average and lie in the middle of the values, it is known as ‘measures of central tendency.’ The summary values that are representative of the various distributions are known as measures of central tendency. The commonly used measures of central tendency are :
- Arithmetic mean or the Average
- Median
- Mode.
Question 2.
What is a Mean ? What are its types ?
Answer:
Mean or average is a quotient of the sum of several quantities. It is a number that by and large represents a series of numbers. So, average can be taken as the central value or tendency of the population, in this case, all the students of your class.
Mean or average can be of three types :
1. Arithmetic
2. Geometric, and
3. Harmonic mean.
Question 3.
Define the term Arithmetic ‘mean’. How is it determined ?
Answer:
Mean
The most frequently used measure of central tendency is the mean or the average. The mean is simply the sum of all the values of a series divided by their number. Example. Suppose the monthly income of five agricultural labour families in a village is ₹ 100, ₹ 80, ₹ 120, ₹ 90 and ₹ 60. The mean monthly income of these families
\(\overline{\mathrm{X}}=\frac{100+80+120+90+60}{5}=\frac{450}{5}=₹ 90\)
Procedure:
(i) This is a simple measure of average.
(ii) Add all the values to get Σx
(iii) Divide it by the number of items (N)
\(\text { Mean }=\bar{x}=\frac{\Sigma x}{N}\)
(1) For Ungrouped data. Supposing there are ‘n’
agricultural labour families in a village and their income of the 1st, 2nd, 3rd and the nth family is Xj, X2, X3 Xn. The mean would be
\(\begin{aligned}
\overline{\mathrm{X}} &=\frac{\mathrm{X}_{1}+\mathrm{X}_{2}+\mathrm{X}_{3} \ldots \ldots \ldots . .+\mathrm{X}_{n}}{n}=\frac{\Sigma \mathrm{X}}{n} \\
\text { where } \overline{\mathrm{X}} &=\text { mean }
\end{aligned}\)
∑ X = the sum of all values
n = no. of items
(2) For Grouped data. In this case, the mean is calculated by the following two methods:
(i) Direct method
(ii) Short-cut method.
Example. Calculate the mean for the data given in the following table:
| S. No. | Land Holding (Acres) | Number of Farmers |
| 1. | 0 – 5 | 4 |
| 2. | 5 – 10 | 5 |
| 3. | 10 – 15 | 8 |
| 4. | 15 – 20 | 10 |
| 5. | 20 – 25 | 3 |
| Total | 30 |
Procedure.
(i) This is the simplest method where the frequency (l) of each item is given.
(ii) Find out the mid-value of each class interval. Multiply it by the frequency to find out f(X).
(iii) Add all the values of f(X) and divide it by the number of items.
\(\overline{\mathrm{X}}=\frac{\Sigma f(\mathrm{X})}{\mathrm{N}}\)
Solution:
(i) Direct Method
| Land Holding | Number of Farmers (f) | Mid-Values (X) | f(X) |
| 0 – 5 | 2.5 | 4 x 2 – 5 = 10.0 | |
| 5 – 10 | 5 | 7.5 ‘ | 5 x 7 – 5 = 37 – 5 |
| 10 – 10 | 8 | 12.5 | 8 x 12 – 5= 1000 |
| 15 – 20 | 10 | 17.5 | 10 x 17 – 5 = 175 0 |
| 20 – 25 | 3 | 22-5 | 3 x 22 – 5 = 67 – 5 |
| n=30 | ∑f(x) = 3900 |
(ii) Short-cut Method
Procedure :
(i) Find out the mid-value (x) of each class interval.
(ii) Assume a mid-value as assumed Mean.
(iii) Find out the deviation of different values (dX) from the assumed Mean by subtracting the assumed average (A) from the mid-values (X).
(iv) Multiply (dx) by frequency (f) and add these
\(\overline{\mathrm{X}}=\mathrm{A}+\frac{\Sigma f d x}{\mathrm{~N}}\)
Assumed Mean = 12.5 acres.
| Land Holdings | Mid values (x) | dx = X-A | Number of Farmers (f) | f.dx |
| 0 – 5 | 2.5 | -10 | 4 | -10 |
| 5 – 10 | 7.5 | -5 | 5 | -25 |
| 10 – 15 | 12.5 | 0 | 8 | 0 |
| 15 – 20 | 17.5 | 5 | 10 | 50 |
| 20 – 25 | 22.5 | 10 | 3 | 30 |
| n = 30 | Σ.f.dx- 15 |
\bar{X} &=A+\frac{\Sigma f d x}{n} \\
&=12 \cdot 5+\frac{15}{30}=13 \text { acres. }
\end{aligned}\)
Question 4.
Calculate the mean for the following data.
Answer:
| Marks obtained | No. of Students |
| 0-10 | 5 |
| 10-20 | 10 |
| 20-30 | 40 |
| 30 – 40 | 20 |
| 40 – 50 | 25 |
Solution:
(i) Direct Method
| Marks Obtained | Mid-values (X) | No. of Students (f) | f.x. |
| 0-10 | 5 | 5 | 5×5 ~25 |
| 10-20 | 15 | 10 | 15 x 10 = 150 |
| 20-30 | 25 | 40 | 25 x 40= 1000 |
| 30 – 40 | 35 | 20 | 35 x 20 = 700 |
| 40 – 50 | 45 | 25 | 45 x 25 = 1125 |
| n = 100 | ∑fx = 3000 |
\text { Mean } &=\overline{\mathrm{X}}=\frac{\Sigma f x}{n} \\
&=\frac{3000}{10}=30
\end{aligned}\)
(ii) Short-cut method :
Assumed Mean = 25
| Marks Obtained | Mid-values X | dx = X – A | No. of Students (f) | f.dx |
| 0 – 10 | 5 | -20 | 5 | -100 |
| 10 – 20 | 15 | -10 | 10 | -100 |
| 20 – 30 | 25 | 0 | 40 | 0 |
| 30 – 40 | 35 | 10 | 20 | 200 |
| 40 – 50 | 45 | 20 | 25 | 500 |
| n = 100 | ∑ fdx = 500 |
\text { Mean }=\bar{X} &=A+\frac{\Sigma f d x}{n} \\
&=25+\frac{500}{100}=25+5=30 \text { marks. }
\end{aligned}\)
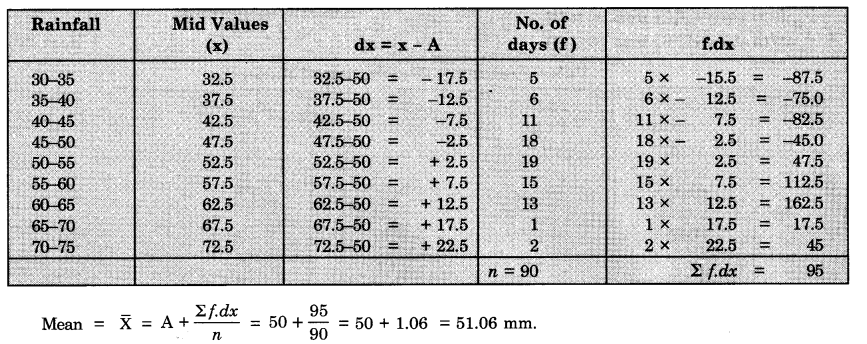
Question 5.
Calculate the mean from the given data of rainfall of a place.
| Rainfall (Millimetres) | No. of Days |
| 30 – 35 | 5 |
| 35 – 40 | 6 |
| 40 – 45 | 11 |
| 45 – 50 | 18 |
| 50 – 55 | 19 |
| 55 – 60 | 15 |
| 60 – 65 | 13 |
| 65 – 70 | 1 |
| 70-75 | 2 |
Solution:
(i) Direct Method :
| Rainfall | Mid values (x) | No.of Days (f) | f.x |
| 30-35 | 32.5 | 5 | 162.5 |
| 35-40 | 37.5 | 6 | 225.0 |
| 40-45 | 42.5 | 11 | 467.5 |
| 45 – 50 | 47.5 | 18 | 855.0 |
| 50 – 55 | 52.5 | 19 | 997.5 |
| 55 — 60 | 57.5 | 15 | 862.5 |
| 60-65 | 62.5 | 13 | 812.5 |
| 65 – 70 | 67.5 | 1 | 67.5 |
| 70-75 | 72.5 | 2 | 145.0 |
| n = 90 | ∑ fx = 4595.0 |
\text { Mean }=\overline{\mathrm{X}} &=\frac{\Sigma f x}{n} \\
&=\frac{4595}{90}=51.06 \mathrm{~mm} .
\end{aligned}\)
(ii) Short-cut method :
Question 6.
The percentage of marks obtained by 50 students is given below. Calculate the Arithmetic mean.
Answer:
Percentage of Marks
| 59 | 47 | 87 | 46(L) | 91 |
| 68 | 80 | 65 | 50 | 69 |
| 95 | 77 | 96(H) | 94 | 82 |
| 84 | 91 | 49 | 92 | 74 |
| 88 | 83 | 79 | 88 | 79 |
| 76 | 94 | 63 | 82 | 57 |
| 81 | 78 | 87 | 71 | 65 |
| 75 | 62 | 83 | 69 | 80 |
| 79 | 58 | 67 | 55 | 76 |
| 93 | 63 | 70 | 63 | 56 |
Answer:
We calculate the A.M. in the following steps:
Step-1. The lowest (L) and highest (H) values are L = 46, H = 96
Step-2. Calculate the range (R) by deducting L from H
i.e. R = H – L
∴ R = 96 – 46 = 50
Step-3. Divide the range by the desired number of classes (N) to determine the class intervals (C.I.)
\(\begin{array}{l}
\mathrm{C.I.}=\frac{\mathrm{R}}{\mathrm{N}} \\
\text { C.I. }=\frac{50}{5}=10
\end{array}\)
taking N = 5*
The number of classes should neither be too small nor too large.
Step-4. Determine the class the limits (lower and upper boundaries) by adding C.I. as many times with L as the number of classes till the H value is obtained.
Thus, the lowest limit = 46 (Lowest value)
next limit = 46 + (1 x 10) = 56
next limit = 46 + (2 x 10) = 66
next limit = 46 + (3 x 10) = 76
next limit = 46 + (4 x 10) = 86
and the highest limit = 46 + (5 x 10)
= 96 (Highest value)
So, 1st class will be from 46 to 56 Ilnd class will be from 56 to 66 Illrd class will be from 66 to 76 IVth class will be from 76 to 86
Vth class will be from 86 to 96.
Step-5. Arrange the data in the frequency table with 5 classes by tally methods
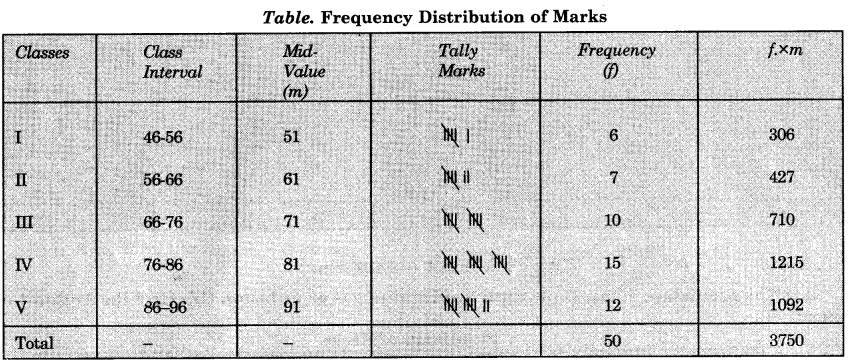
Step-6. Now the frequencies are multiplied by the respective mid-values and the products which are added to get
∑ f x m.
Step-7. The A.M. is calculated using
\(\begin{aligned}
\overline{\mathrm{X}} &=\frac{\Sigma f \times m}{\Sigma f} \\
\mathrm{A.M.} &=\frac{3750}{50}=75
\end{aligned}\)
Question 7.
Describe the merits and demerits of Arithmetic Mean.
Answer:
Merits of Arithmetic Mean.
1. Simplicity. It is the most simple of all the methods of central tendency and is easy to understand.
2. Representative Value. This is the representative value of all the values of a series.
3. Certain Value. It has a definite value and remains same all the time.
4. Stable Value. It has a stable value. The changes in the values of samples do not affect it.
5. Basis of Comparison. It can be used to compare the value of a series.
6. Fair Value. It gives a fair wholesome idea of all values.
7. Balanced Value. It balances the values of entire distribution.
Demerits of Arithmetic Mean
1. Effect of Extreme Values. The mean is affected by extreme values of the series because there is a wide gap. For example, the monthly salary of a company manager is ₹ 50,000/-. The monthly salary of the other three employees is ₹ 3500/-, ₹ 1500/-,₹ 1000/. The average salary will be:
\(\begin{array}{l}
=\frac{50000+3500+1500+1000}{4} \\
=\frac{56000}{4}=₹ 14000
\end{array}\)
This is not a representative value.
2. The Arithmetic mean is not present in the series.
3. Arithmetic mean sometimes gives a distorted picture.
Question 8.
What is Geometric Mean ? How is it calculated ?
Answer:
Geometric Mean (G.M.)
Geometric Mean (G.M.) is used to compute the rate of growth of any item.
The G.M. of n values, for example,
x1, x2, x3 ……………….. xn is defined as the nth root of the
product of these values.
So, we may express this mathematically as :
\(\text { G. M. }=\left(x_{1} \cdot x_{2} \cdot x_{3} \ldots x_{n}\right)^{\frac{1}{n}}\)
The G.M may be calculated using following example:
Growth rates of the economy in 4 years are given as 4%, 8%, 8% and 16% respectively.
\(\text { So G.M. }=(4 \times 8 \times 8 \times 16)^{1 / 4}\)
\(=(4096)^{\frac{1}{4}}\)
Uses of G.M.
G.M. is more suitable average if data are given in terms of ratios or in terms of change in which use of A.M. may lead to inconsistent results.
Question 9.
Define the term Median. How is it calculated ?
Answer:
Median. Median is used as a measure of central tendency. Median is the positional average. It is defined as the middle most value of variables. It is denoted as M. It is the mid-value of a series. Median is that value which divides a series into two equal parts. One- half includes the values which are more than the median while the second half includes the values which are less than the median. For example—40, 42, 38, 45, 50, 25, 55 has a median of 45.
Example. Calculate the median when age of five individuals A,B, C, D and E are respectively 20, 21, 19, 23 and 22 years.
We determine the median in the following steps: Step-1. Arrange the data is ascending or descending order in a tabular format:
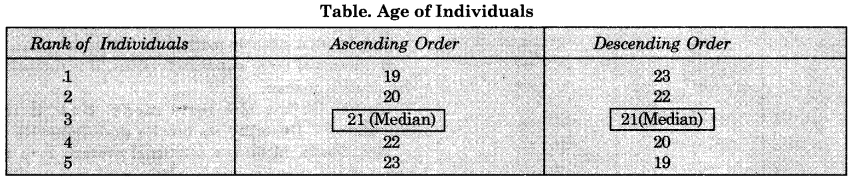
Step – 2. The value of the middle number is the median.
Step – 3. The middle number is calculated by
Therefore, the value of 3rd number will be the median.
Median = 21 years
\(\mathrm{M}=\frac{n+1}{2} \text { th item }\)
Where n = 4 (even), \(\text { so } \frac{n+1}{2}=\frac{5+1}{2}=3\)
So, if we have say 4 members, 19, 20, 21 and 22, in this case we will add the values of 2nd and 3rd number and divide the total by 2 :
\(\frac{20+21}{2}=20.5 \text { years}\)
In that case Median = 20.5 years.
Uses of Median
1. Median is the middle most value, so the extreme values do not vitiate its representative character as in case of A.M.
2. The median is the centre of gravity for the entire distribution.
3. Use of median is however not very common. The Median (M) for a large number of distributions
Question 10.
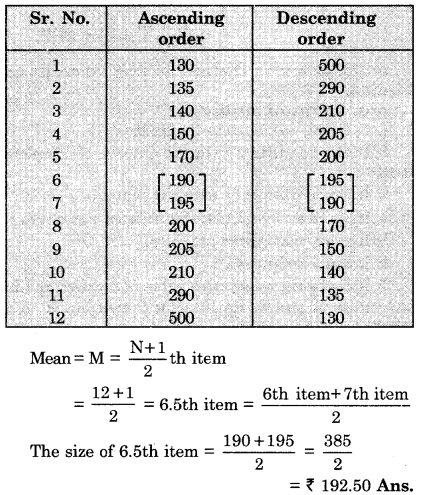
The monthly income of 12 households in a locality are ₹ 140,150,130,135,170,190, 500, 210, 205,195, 290, 200.
Find out the median income.
Answer:
(1) Arrange the income in an ascending order as :
130, 135, 140, 150, 170, 190, 195, 200, 205, 210, 290 and 500.
(2) Arrange the incomes in descending order as 500, 290. 210, 205, 200,195,190, 170, 150,140, 135 and 130
Question 11.
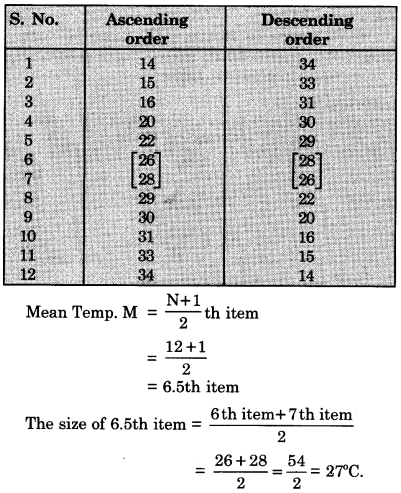
The following table gives the mean monthly temperatures of Delhi. Find out the median temperature of Delhi.
| Sr. No. | 1 | 2 | 3 | 4 | 5 | 6 | 7 | 8 | 9 | 10 | 11 | 12 |
| Month | J | F | M | A | M | J | J | A | S | O | N | D |
| Temp. (°C) | 14 | 16 | 22 | 2$ | 33 | 34 | 31 | 30 | 29 | 26 | 20 | 15 |
Answer:
Arrange the figures in ascending order and descending order.
Question 12.
Describe the merits and demerits of Median.
Answer:
Merits of median :
1. It is easy to calculate the median.
2. It can be calculated in the absence of complete data.
3. It is not affected by extreme values of a series.
4. It can be easily calculated in an open ended series.
5. It can be calculated graphically.
6. It has a definite value.
7. It is the representative value of a series and in the centre of gravity for the entire distribution of a series.
We can determine the Mode in the following steps—
Demerits
1. It takes more time to arrange the series in ascending and descending order.
2. It does not depend on all the values of a series.
3. It is not an exact value as it does not consider the extreme values.
4. It is an approximate value when the values are even.
5. It is not a suitable method for irregular values.
6. In case of large number of values, it is difficult to calculate median.
Question 13.
Define the term mode. How is it calculated ? Describe its merits and demerits.
Answer:
Mode. Mode is a positional average. It is a value of the variable which occurs most frequently. Mode is a measure of central tendency and is the most frequently occurring value in a series. It is a typical value around which most of the items tend to cluster. It is the representative value of a series around which there is maximum concentration.
Inspection method to determine the mode. In this method, the value is determined which occurs mostly in a series. When the frequency of a discrete series increases or decreases regularly, the mode is clearly known.
Example :
| Wages (₹) | No. of workers |
| 10 | 2 |
| 20 | 3 |
| 30 | 7 |
| 40 | 8 |
| 50 | 4 |
| 60 | 5 |
It is evident that the frequency of ₹ 40 is the maximum. Therefore, the mode is Z = ₹ 40.
Example. Determine the mode from the following distributions—
2, 10, 5, 7, 7, 9, 2, 7, 11, 17, 7, 8
| SI. No./Type | 1 | 2 | 3 | 4 | 5 | 6 | 7 | 8 | 9 | 10 | 11 | 12 |
| Ascending | 2 | 2 | 5 | 7 | ‘ 7 | 7 | 7 | 8 | 9 | 10 | 11 | 17 |
| Descending | 17 | 11 | 10 | 9 | 8 | 7 | 7 | 7 | 7 | 5 | 2 | 2 |
Step 1. Arrange the data in ascending and descending order in Table.
Step 2. In both the ascending and descending order value ‘7’ is occurring most frequently i.e. 4 times.
So the mode is 7.
Merits of Mode.
(i) It is easy to understand mode by inspection method
(ii) Extreme values do not affect mode
(iii) It is the representative value of a series
(iv) It can be calculated in the absence of complete data
(v) Mode can be used in certain types of distributions, in which values are whole numbers
(vi) It can be shown on a graph also.
Demerits of Mode
(i) It becomes uncertain value when two variables occur equal times
(ii) It is not based on all the variables
(iii) It sometimes gives a distorted picture.
Question 14.
What do you mean by measures of deviation ?
Answer:
Measures of Deviation
Deviation or Dispersion simply means scattering or variation of the variables about a central value.
We can take four alternative measures of deviation—
- Range
- Mean Deviation or Absolute Deviation
- Standard Deviation
- Quartile Deviation
Question 15.
What is range ? How is mean deviation calculated ?
Answer:
Range (R)
The range is the simplest of the measures of deviation. It is defined as the difference between the highest (H) and the lowest (L) values of a given set of measurements.
Range = Highest – Lowest
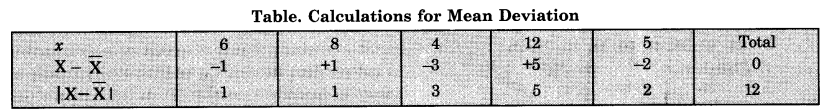
Step 3. So the mean deviation is
\(\frac{\Sigma|X-\bar{X}|}{N}=\frac{12}{5}\)
Question 16.
What do you mean by Standard Deviation and Quartile Deviation ?
Answer:
Standard Deviation
Another measure of deviation calculated using A.M.
\((\overline{\mathrm{X}})\) is Standard Deviation (σ) This is also known as Root Mean Square Deviation. This can be mathematically formulated as:
\((\sigma)=\sqrt{\left[\frac{\sum(\mathrm{X}-\overline{\mathrm{X}})^{2}}{\mathrm{~N}}\right]}\)
Example. Determine the range for the following percentage of marks obtained by 5 students 83, 96, 72, 46, 68 respectively.
Answer:
We determine the range in the following manner—
Step 1. Determine the highest (H) and lowest (L) values in this case H = 96 and L – 46.
Step 2. We calculate the range using formula R = H – L
(Range) R = 96 — 46 = 50%
Use of Range
A range is rather a crude measure of deviation because it does not indicate anything about the way the values are distributed within the range.
Mean Deviation Or Absolute Deviation
Mean Deviation (M.D.) is the absolute deviation (i.e. ignoring sign) from Mean \((\overline{\mathrm{X}})\)
We can mathematically put M.D. as—
\(\text { M.D. }=\frac{\Sigma|X-\bar{X}|}{N}\)
Where X = any value of population
\((\overline{\mathrm{X}})\) = The mean of population
N = Total number of population
Example.
Determine the Mean Deviation (M.D.) for the following population 6, 8, 4, 12, 5.
Answer:
We calculate the M.D. in the following steps:
Step 1. Calculate A.M. (X) as mentioned earlier.
\(\overline{\mathrm{X}} \text { (Arithmetic Mean) }=\frac{6+8+4+12+5}{5}=\frac{35}{5}=7\)
Step 2. Deduct the value of \((\overline{\mathrm{X}})\) from individual member in a tabular format. The square of the S.D. is known as ‘variance’.
Example. Calculate Standard Deviation of the following distribution of 6,8,4,2,5.
Answer:
We calculate the S.D. (σ) in the following steps:
Step 1. Determine the A.M \((\overline{\mathrm{X}})\)
\(\overline{\mathrm{X}}=\frac{6+8+4+2+5}{5}=5\)
Step 2. Determine the square deviations from A.M. in a tabular format as shown in table below.
\(\sigma=\sqrt{\frac{20}{5}}=\sqrt{4}=2\)
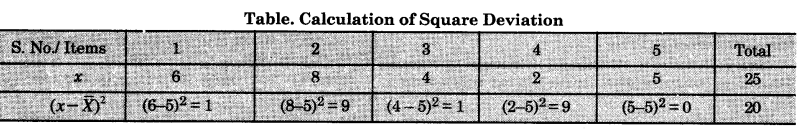
So the Standard Deviation of the above distribution is
σ = 2
Quartile Deviation
Median (M) divides the total distribution into two equal halves but quartiles divide the total distribution into 4 equal parts. This is called Partition value also. Any series has three Quartiles Q1, Q2 and Q3.
- The lower quartile (Q1) is such that 14th of the total distribution will be less than it and %th of the total distribution will be above this value.
- The middle Quartile (Q2) is such that 54 of the total distribution will be below it and 14 above it. Thus, middle quartile (Q2) is nothing but the median (Me).
- The upper quartile Q3 will divide the entire distribution in such a manner that %th will be less than this and 14th above it. The quartile deviation (Q.D.) is called as semi interquartile range which may be expressed as—
\(\text { Q.D. }=\frac{\mathrm{Q}_{3}-\mathrm{Q}_{1}}{2}\)
Example Determine the Quartile Deviation for the following distribution
46, 32, 25, 50, 72, 35, 75, 65, 58
Answer:
We can determine the Q.D. in the following steps:
Step. 1. Arrange the distribution in ascending order and rank them serially as below:
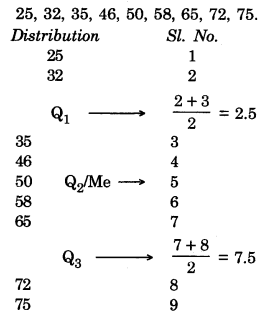
Step 2. The middle quartile (Q2) or the median (Me) is the middle most member, i.e.
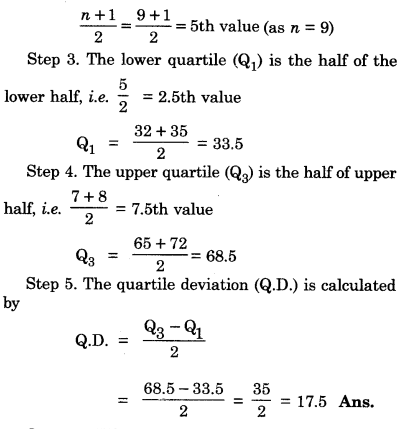
Question 17.
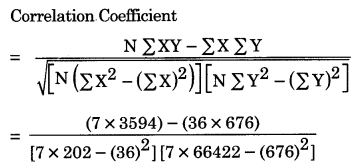
What is Correlation ? How is correlation coefficient determined ?
Answer:
Correlation
A distribution of two sets of variables is known as bivariate distribution where these two variables are said to be correlated if the change of one variable results in a corresponding change in the other variable. The first variable causing a change of second variable is known as independent variable (X) and the other variable is known as dependent variable (Y).
As estimation of the strength and direction of the association between two variables is called simple or bivariate correlation. The most commonly used measures of correlation is known as Pearson’s product moment correlation co-efficient (r).
The value of r ranges between + 1 to – 1. Thus, when:
- r = + 1. The correlation is perfect and positive.
- r – 0. No correlation or Zero correlation.
- r = – 1. The correlation is perfect and negative.
The product moment correlation co-efficient may be mathematically expressed as:
\(r=\frac{N \sum X Y-\sum X \sum Y}{\sqrt{\left[N \sum X^{2}-\left(\sum X\right)^{2}\right]\left[N \sum Y^{2}-\left(\sum Y\right)^{2}\right]}}\)
Where X is the independent variable
Y is the dependent variable
N is the total number of distribution.
Question 18.
Calculate the Pearson’s Correlation Coefficient from the following size of plots and selling prices:
| Plot size (ha) | 10 | 16 | 19 | 22 | 28 |
| Price (₹) | 45 | 55 | 75 | 100 | 105 |
Answer:
Step—I. Arrange the data sequentially in a proper table showing separately the two variables. Add them separately.
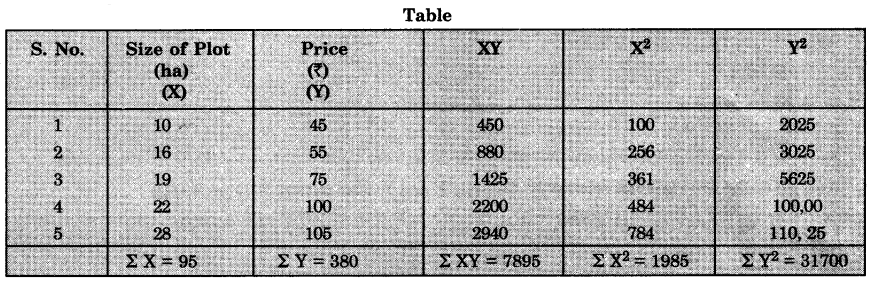
Step-2. Using formula we calculate Pearson’s Product moment correlation co-efficient. So it may be said that price of land is perfectly and positively correlated with the size of the land.
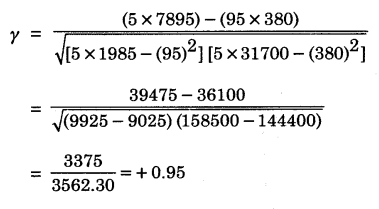
So it may be said that price of land is perfectly and positively correlated with the size of the land.
Question 19.
Compute the Standard Deviation from the following data
15, 18, 20, 12, 10, 9, 11.
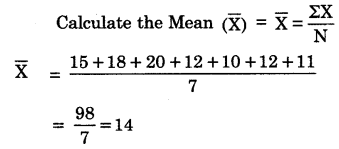
Find out the root deviation from the Table.
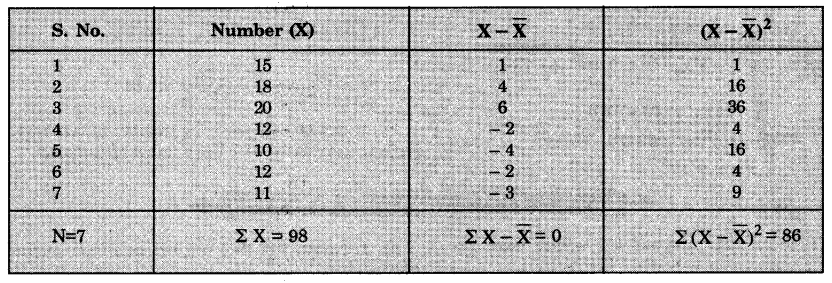
Standard Deviation (S.D.)
\(=\rho=\sqrt{\frac{\Sigma(\mathrm{X}-\overline{\mathrm{X}})^{2}}{\mathrm{~N}}}=\sqrt{\frac{86}{7}}=\sqrt{12.28}=3.5 \)
Question 20.
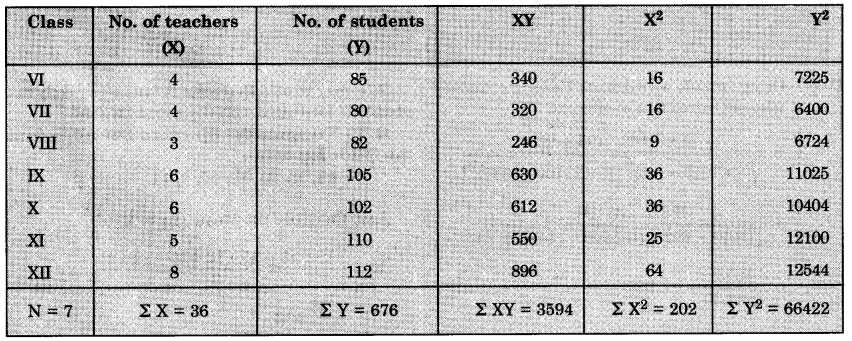
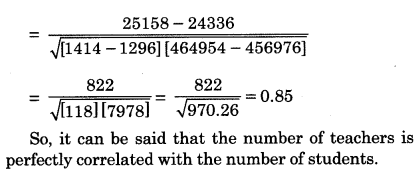
The table below shows the relation between teachers and students of a school. Find out the nature of correlation between the teachers and students.
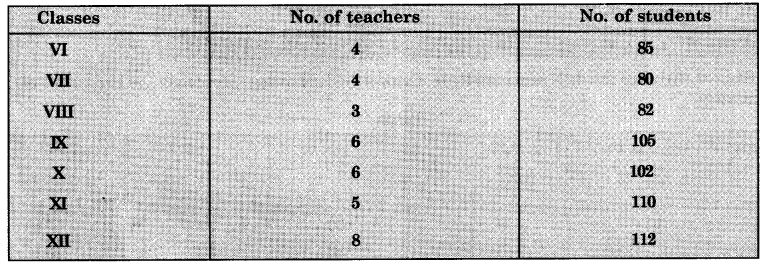
Answer:
Show the two variables separately. Multiply X and Y. Find out the squares of each.