Check the below NCERT MCQ Questions for Class 8 Maths Chapter 15 Introduction to graphs with Answers Pdf free download. MCQ Questions for Class 8 Maths with Answers were prepared based on the latest exam pattern. We have provided Introduction to graphs Class 8 Maths MCQs Questions with Answers to help students understand the concept very well. https://ncertmcq.com/mcq-questions-for-class-8-maths-with-answers/
Students can also refer to NCERT Solutions for Class 8 Maths Chapter 15 Introduction to Graphs for better exam preparation and score more marks.
Introduction to graphs Class 8 MCQs Questions with Answers
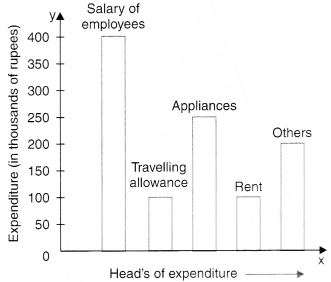
Observe the following bar graph and answer the related questions:
MCQ On Pie Chart For Class 8 Question 1.
On which head, is the expenditure maximum ?
(a) Travelling allowance
(b) Rent
(c) Appliances
(d) Salary of employees.
Answer
Answer: (d) Salary of employees.
Hint:
The length of the bar corresponding to the head ‘salary of employees’ is maximum.
Introduction To Graphs Class 8 MCQ Question 2.
On which head/heads, is the expenditure minimum ?
(a) Travelling allowance/rent
(b) Appliances
(c) Salary of employees
(d) Others.
Answer
Answer: (a) Travelling allowance/rent
Hint:
The length of the bar corresponding to the head travelling allowance/rent is minimum.
MCQ On Introduction To Graphs Class 8 Question 3.
On which two heads, is the expenditure same ?
(a) Salary of employees and others
(b) Travelling allowance and rent
(c) Appliances and rent
(d) Appliances and others.
Answer
Answer: (b) Travelling allowance and rent
Hint:
The lengths of the bars corresponding to the heads travelling allowance and rent are the same.
Class 8 Maths Chapter 15 MCQ Question 4.
What is the difference of expenditures (in thousands of rupees) on salary of employees and rent ?
(a) 100
(b) 200
(c) 300
(d) 400.
Answer
Answer: (c) 300
Hint:
400 – 100 = 300
MCQ Questions For Class 8 Maths With Answers Pdf Question 5.
What is the sum of the expenditures (in thousands of rupees) on travelling allowance and rent ?
(a) 100
(b) 200
(c) 300
(d) 400.
Answer
Answer: (b) 200
Hint:
100 + 100 = 200
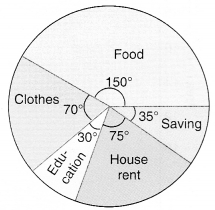
Observe the following circle-graph and answer the related questions:
Introduction To Graphs Class 8 Extra Questions MCQ Question 6.
On which head is the expenditure maximum ?
(a) Food
(b) Clothes
(c) House rent
(d) Education.
Answer
Answer: (a) Food
Hint:
The central angle is maximum for food.
MCQ On Bar Graph For Class 8 Question 7.
On which head is the expenditure minimum ?
(a) Education
(b) House rent
(c) Food
(d) Clothes.
Answer
Answer: (a) Education
Hint:
The central angle is minimum for education.
Introduction To Graphs Class 8 Extra Questions Question 8.
If the budget of the family is Rs 10800, what is the saving ?
(a) Rs 1050
(b) Rs 1000
(c) Rs 950
(d) Rs 1200.
Answer
Answer: (a) Rs 1050
Hint:
Saving = \(\frac{35}{360}\) × 10800 = 1050.
Introduction To Graphs Class 8 MCQ With Answers Question 9.
What is the difference of expenditures on clothes and education if the budget of the family is Rs 10800 ?
(a) Rs 1200
(b) Rs 1000
(c) Rs 800
(d) Rs 1500.
Answer
Answer: (a) Rs 1200
Hint:
70 – 30 = 40
\(\frac{40}{360}\) × 10800 = 1200.
Class 8 MCQ Questions Maths Question 10.
What is the sum of the expenditures on food and education if the budget of the family is Rs 10800 ?
(a) Rs 5000
(b) Rs 8000
(c) Rs 5400
(d) Rs 6000.
Answer
Answer: (c) Rs 5400
Hint:
150 + 30 = 180
\(\frac{180}{360}\) × 10800 = 5400
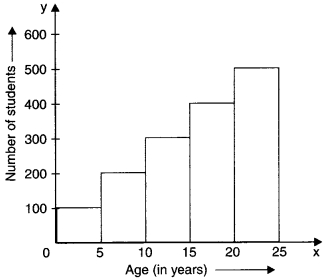
Observe the following histogram and answer the related questions:
Question 11.
In which class interval, are the maximum number of students ?
(a) 0-5
(b) 5-10
(c) 20-25
(d) 15-20.
Answer
Answer: (c) 20-25
Hint:
The length of the rectangle on 20 – 25 is maximum.
Question 12.
In which class interval, are the minimum number of students ?
(a) 0-5
(b) 5-10
(c) 10-15
(d) 15-20.
Answer
Answer: (a) 0-5
Hint:
The length of the rectangle on 0 – 5 is maximum.
Question 13.
In which class intervals, is the number of students 200 ?
(a) 5-10
(b) 0-5
(c) 20-25
(d) 15-20.
Answer
Answer: (a) 5-10
Hint:
5-10 → 200
Question 14.
The difference in the number of students of class intervals 0-5 and 5-10 is
(a) 100
(b) 200
(c) 300
(d) 400.
Answer
Answer: (a) 100
Hint:
0-5 → 100
5-10 → 200
200-100 = 100
Question 15.
The sum of the number of students in the class intervals 10-15 and 20-25 is
(a) 800
(b) 900
(c) 600
(d) 400.
Answer
Answer: (a) 800
Hint:
10-15 → 300
20-25 → 500
300 + 500 = 800.
Observe the following temperature time graph and answer the related questions:
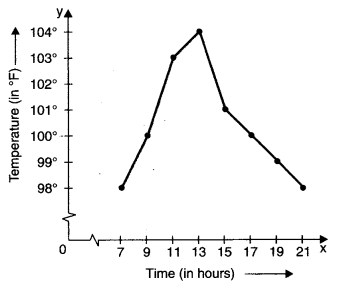
Question 16.
At what time is the temperature maximum ?
(a) 13 hours
(b) 15 hours
(c) 11 hours
(d) 19 hours.
Answer
Answer: (a) 13 hours
Hint:
13 hours → 104°F
Question 17.
At what time(s) is the temperature minimum ?
(a) 7 hours and 21 hours
(b) 9 hours
(c) 11 hours
(d) 13 hours.
Answer
Answer: (a) 7 hours and 21 hours
Hint:
7, 21 → 98°F
Question 18.
103°F temperature is at time
(a) 11 hours
(b) 13 hours
(c) 15 hours
(d) 21 hours.
Answer
Answer: (a) 11 hours
Hint:
103°F → 11 hours
Question 19.
What is the difference of temperatures at 7 hours and 21 hours ?
(a) 0°F
(b) 1°F
(c) 2°F
(d) 3°F.
Answer
Answer: (a) 0°F
Hint:
98-98 = 0
Question 20.
What is the rise in temperature from 11 hours to 13 hours ?
(a) 1°F
(b) 2°F
(c) 4°F
(d) 3°F.
Answer
Answer: (a) 1°F
Hint:
104 – 103 = 1
Question 21.
What is the fall in temperature from 13 hours to 21 hours ?
(a) 2°F
(b) 3°F
(c) 4°F
(d) 6°F
Answer
Answer: (d) 6°F
Hint:
104 – 98 = 6
Question 22.
The coordinates of the origin are
(a ) (0, 0)
(b) (1, 0)
(c) (0, 1)
(d) (1, 1).
Answer
Answer: (a ) (0, 0)
Hint:
0 → (0, 0)
Question 23.
What are the coordinates of a point whose x-coordinate is 3 and y-coordinate is 4?
(a) (3, 3)
(b) (3, 4)
(c) (4, 3)
(d) (4, 3).
Answer
Answer: (b) (3, 4)
Question 24.
What are the coordinates of a point whose x-coordinate is 1 and y-coordinate isO?
(a) (1, 0)
(b) (0, 0)
(c) (0, 1)
(d) (1, 1).
Answer
Answer: (a) (1, 0)
Question 25.
What are the coordinates of a point whose x-coordinate is 0 and y-coordinate is 1?
(a) (0, 1)
(b) (0, 0)
(c) (1, o)
(d) (1, 1).
Answer
Answer: (a) (0, 1)
Observe the following velocity-time graph and answer the related questions:
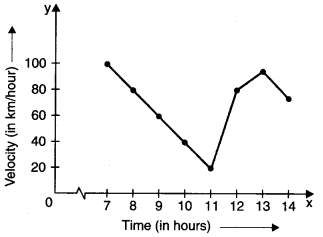
Question 26.
At what time is the velocity maximum ?
(a) 7
(b) 8
(c) 9
(d) 10.
Answer
Answer: (a) 7
Hint:
7 → 100
Question 27.
At what time is the velocity minimum ?
(a) 8
(b) 9
(c) 10
(d) 11.
Answer
Answer: (d) 11
Hint:
11 → 20
Question 28.
At what times are the velocities equal ?
(a) 8 and 12
(b) 9 and 11
(c) 7 and 12
(d) 11 and 13.
Answer
Answer: (a) 8 and 12
Hint:
8 → 80
12 → 80
Question 29.
What is the fall in velocity from 7 to 11 ?
(a) 80 km/hour
(b) 90 km/hour
(c) 100 km/hour
(d) 20 km/hour.
Answer
Answer: (a) 80 km/hour
Hint:
100 – 20 = 80
Question 30.
What is the rise in velocity from 11 to 12?
(a) 10 km/hour
(b) 20 km/hour
(c) 30 km/hour
(d) 60 km/hour.
Answer
Answer: (d) 60 km/hour
Hint:
80 – 20 = 60
Observe the following runs-over graph and answer the related questions:
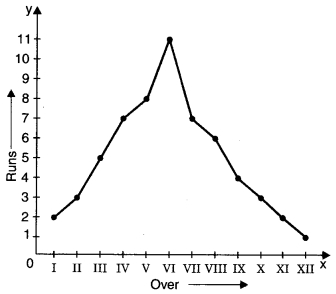
Question 31.
In which over are the maximum runs scored ?
(a) II
(b) IV
(c) V
(d) VI.
Answer
Answer: (d) VI
Hint:
VI → 11
Question 32.
In which over are the minimum runs scored ?
(a) X
(b) XI
(c) XII
(d) IX.
Answer
Answer: (c) XII
Hint:
XII → 1
Question 33.
What is the difference of runs scored in IV and V overs ?
(a) 1
(b) 2
(c) 3
(d) 4.
Answer
Answer: (a) 1
Hint:
8 – 7 = 1
Question 34.
What is the sum of runs scored in I and XII overs ?
(a) 1
(b) 2
(c) 3
(d) 4.
Answer
Answer: (c) 3
Hint:
2 + 1 = 3
Question 35.
3 runs are scored in which overs ?
(a) II and X
(b) I and V
(c) VII and VIII
(d) X and XII
Answer
Answer: (a) II and X
Hint:
II → 3, X → 3
Read the graph and answer the related questions:
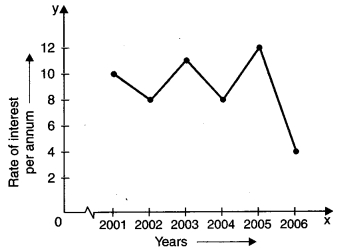
Question 36.
In which year was the rate of interest maximum ?
(a) 2005
(b) 2003
(c) 2006
(d) 2002.
Answer
Answer: (a) 2005
Hint:
2005 → 12
Question 37.
In which year was the rate of interest minimum ?
(a) 2006
(b) 2004
(c) 2001
(d) 2005.
Answer
Answer: (a) 2006
Hint:
2006 → 4
Question 38.
The difference in the maximum and minimum rates of interest was
(a) 2%
(b) 4%
(c) 6%
(d) 8%.
Answer
Answer: (d) 8%
Hint:
12 – 4 = 8
Question 39.
Rise in interest from 2004 to 2005 was
(a) 2%
(b) 4%
(c) 6%
(d) 8%.
Answer
Answer: (b) 4%
Hint:
12 – 8 = 4
Question 40.
The fall in interest from 2001 to 2002 was
(a) 1%
(b) 2%
(c) 3%
(d) 4%.
Answer
Answer: (b) 2%
Hint:
10 – 8 = 2
Read the graph and answer the related questions:
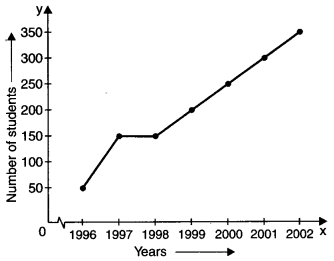
Question 41.
How many students appeared in the year 2000 ?
(a) 200
(b) 250
(c) 300
(d) 350.
Answer
Answer: (b) 250
Hint:
2000 → 250
Question 42.
In which year did 50 students appear ?
(a) 1998
(b) 2001
(c) 1997
(d) 1996.
Answer
Answer: (d) 1996
Hint:
50 → 1996
Question 43.
In which year did the maximum number of students appear ?
(a) 2002
(b) 2000
(c) 2001
(d) 1999.
Answer
Answer: (a) 2002
Hint:
2002 → 350
Question 44.
What is the maximum number of students that appeared in any year ?
(a) 350
(b) 300
(c) 250
(d) 300.
Answer
Answer: (a) 350
Hint:
350
Question 45.
In which two years was the number of students appearing was the same ?
(a) 1997 and 1998
(b) 1998 and 1999
(c) 1999 and 2000
(d) 2000 and 2001.
Answer
Answer: (a) 1997 and 1998
Hint:
1997 → 150
1998 → 150
Read the graph and answer the related questions:
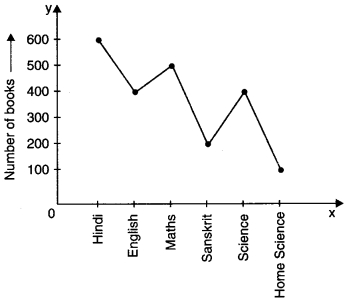
Question 46.
The maximum books are of which subject ?
(a) Hindi
(b) Science
(c) English
(d) Sanskrit.
Answer
Answer: (a) Hindi
Hint:
Hindi → 600
Question 47.
The minimum books are of which subject ?
(a) Home Science
(b) Sanskrit
(c) Science
(d) English
Answer
Answer: (a) Home Science
Hint:
Home Science → 100
Question 48.
500 books are of which subject ?
(a) English
(b) Science
(c) Hindi
(d) Maths.
Answer
Answer: (d) Maths
Hint:
500 → Maths
Question 49.
How many books are of subject Home Science ?
(a) 100
(b) 200
(c) 300
(d) 400.
Answer
Answer: (a) 100
Hint:
Home Science → 100
Question 50.
How many books are there in Sanskrit and Home Science taken together ?
(a) 100
(b) 200
(c) 300
(d) 400.
Answer
Answer: (c) 300
Hint:
Sanskrit → 200
Home Science → 100
200 + 100 = 300
Read the graph and answer the related questions:
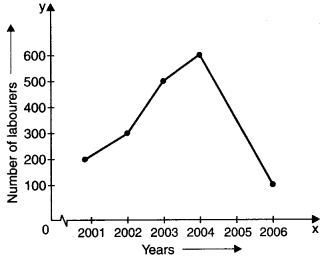
Question 51.
In which year was the number of labourers maximum ?
(a) 2001
(b) 2002
(c) 2003
(d) 2004.
Answer
Answer: (d) 2004
Hint:
2004 → 500
Question 52.
In which year was the number of labourers minimum ?
(a) 2003
(b) 2004
(c) 2005
(d) 2006.
Answer
Answer: (d) 2006
Hint:
2006 → 100
Question 53.
What was the difference of the number of labourers in the years 2002 and 2003 ?
(a) 100
(b) 200
(c) 300
(d) 400.
Answer
Answer: (b) 200
Hint:
2002 → 300
2003 → 500
500 – 300 = 200
Question 54.
Find the rise in the number of labourers from 2001 to 2004.
(a) 200
(b) 300
(c) 400
(d) 500.
Answer
Answer: (c) 400
Hint:
2001 → 200
2004 → 600
600 – 200 = 400
Question 55.
Find the sum of the number of labourers in the years 2004 and 2006.
(a) 700
(b) 600
(c) 200
(d) 500.
Answer
Answer: (a) 700
Hint:
2004 → 600
2006 → 100
600 + 100 = 700
Read the circle graph and answer the related questions:
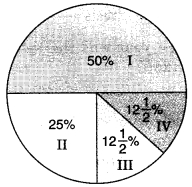
Question 56.
There are in all 1000 students in a school. The number of students of class I are
(a) 500
(b) 250
(c) 125
(d) none of these.
Answer
Answer: (a) 500
Hint:
\(\frac{50}{100}\) × 1000 = 500
Question 57.
The number of students of class II is
(a) 500
(b) 250
(c) 125
(d) 100.
Answer
Answer: (b) 250
Hint:
\(\frac{25}{100}\) x 1000 = 250
Question 58.
In which two classes is the number of students the same ?
(a) I and II
(b) I and III
(c) III and IV
(d) I and IV.
Answer
Answer: (c) III and IV
Hint:
III → 12\(\frac{1}{2}\)%
IV → 12\(\frac{1}{2}\)%
Question 59.
The minimum number of students in any class is
(a) 125
(b) 250
(c) 500
(d) 1000.
Answer
Answer: (a) 125
Hint:
\(\frac{25}{2}\) × \(\frac{1000}{100}\) = 125
Question 60.
The sum of the number of students of class III and class IV is
(a) 500
(b) 1000
(c) 50
(d) 250.
Answer
Answer: (d) 250
Hint:
125 + 125 = 250
Question 61.
A ________ is a bar graph that shows data in intervals.
(a) Bar-graph
(b) Pie-chart
(c) Histograph
(d) Line Graph
Answer
Answer: (c) Histograph
Question 62.
A graph that displays data that changes continuously over periods of time is called:
(a) Bar-graph
(b) Pie-chart
(c) Histograph
(d) Line Graph
Answer
Answer: (d) Line Graph
Question 63.
A line graph which is a whole unbroken line is called a:
(a) Linear graph
(b) Pie-chart
(c) Histograph
(d) Bar-graph
Answer
Answer: (a) Linear graph
Question 64.
Which point lies of y-axis?
(a) (-2, 0)
(b) (2, 0)
(c) (0, -2)
(d) (2, -2)
Answer
Answer: (c) (0, -2)
Question 65.
If we join (-3,2), (-3,-3) and (-3,4), then we obtain:
(a) A triangle
(b) Straight-line without passing through origin
(c) Straight-line passing through origin
(d) None of the above
Answer
Answer: (b) Straight-line without passing through origin
Question 66.
The point (4, 0) lies on which of the following?
(a) x-axis
(b) y-axis
(c) origin
(d) None of the above
Answer
Answer: (a) x-axis
Question 67.
The point (-2,-2) is:
(a) near to x-axis
(b) near to y-axis
(c) near to origin
(d) Equidistant from x-axis and y-axis.
Answer
Answer: (d) Equidistant from x-axis and y-axis.
Question 68.
The point (-2, 5) is nearer to:
(a) x-axis
(b) y-axis
(c) origin
(d) None of the above
Answer
Answer: (a) x-axis
Question 69.
The point (-5, 2) is nearer to:
(a) x-axis
(b) y-axis
(c) origin
(d) None of the above
Answer
Answer: (b) y-axis
Question 70.
The point (0, 0) lies at:
(a) x-axis
(b) y-axis
(c) origin
(d) None of the above
Answer
Answer: (c) origin
We hope the given NCERT MCQ Questions for Class 8 Maths Chapter 15 Introduction to graphs with Answers Pdf free download will help you. If you have any queries regarding Introduction to graphs CBSE Class 8 Maths MCQs Multiple Choice Questions with Answers, drop a comment below and we will get back to you soon.