RS Aggarwal Class 9 Solutions Chapter 14 Statistics Ex 14A
These Solutions are part of RS Aggarwal Solutions Class 9. Here we have given RS Aggarwal Solutions Class 9 Chapter 14 Statistics Ex 14A.
Other Exercises
- RS Aggarwal Solutions Class 9 Chapter 14 Statistics Ex 14A
- RS Aggarwal Solutions Class 9 Chapter 14 Statistics Ex 14B
- RS Aggarwal Solutions Class 9 Chapter 14 Statistics Ex 14C
- RS Aggarwal Solutions Class 9 Chapter 14 Statistics Ex 14D
- RS Aggarwal Solutions Class 9 Chapter 14 Statistics Ex 14E
- RS Aggarwal Solutions Class 9 Chapter 14 Statistics Ex 14F
- RS Aggarwal Solutions Class 9 Chapter 14 Statistics Ex 14G
- RS Aggarwal Solutions Class 9 Chapter 14 Statistics Ex 14H
Question 1.
Solution:
Statistics is a science which deals with the collection, presentation, analysis and interpretations of numerical data.
Question 2.
Solution:
(i) Numerical facts alone constitute data
(ii) Qualitative characteristics like intelligence, poverty etc. which cannot be measured, numerically, don’t form data.
(iii) Data are an aggregate of facts. A single observation does not form data.
(iv) Data collected for a definite purpose may not be suited for another purpose.
(v) Data is different experiments are comparable.
Question 3.
Solution:
(i) Primary data : The data collected by the investigator himself with a definite plan in mind are called primary data.
(ii) Secondary data : The data collected by some one other than the investigator are called secondary data. The primary data is more reliable and relevant.
Question 4.
Solution:
(i) Variate : Any character which is capable of taking several different values is called a variate or variable.
(ii) Class interval : Each group into which the raw data is condensed, is called a class interval
(iii) Class size : The difference between the true upper limit and the true lower limit of a class is called class size.
(iv) Class Mark : \(\frac { upper\quad limit+lower\quad limit }{ 2 } \) is called a class mark
(v) Class limits : Each class is bounded by two figures which are called class limits which are lower class limit and upper class limit.
(vi) True class limits : In exclusive form, the upper and lower limits of a class are respectively are the true upper limit and true lower limit but in inclusive form, the true lower limit of a class is obtained by subtracting O.S from lower limit of the class and for true limit, adding 0.5 to the upper limit.
(vii) Frequency of a class : The number of times an observation occurs in a class is called its frequency.
(viii) Cumulative frequency of a class : The cumulative frequency corresponding to a class is the sum of all frequencies upto and including that class.
Question 5.
Solution:
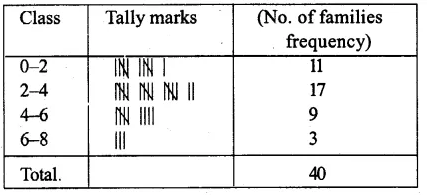
The given data can be represent in form of frequency table as given below:
Question 6.
Solution:
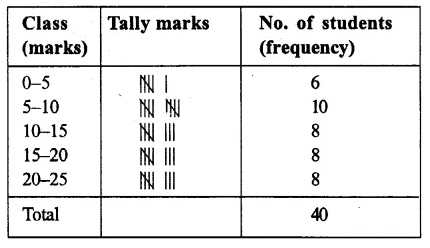
The frequency distribution table of the given data is given below :
Question 7.
Solution:
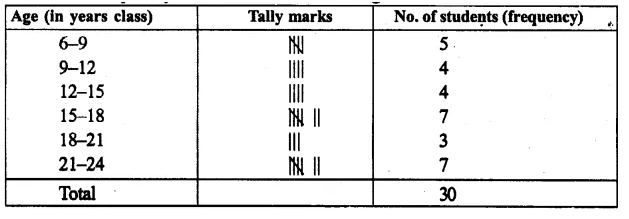
The frequency distribution table of the
Question 8.
Solution:
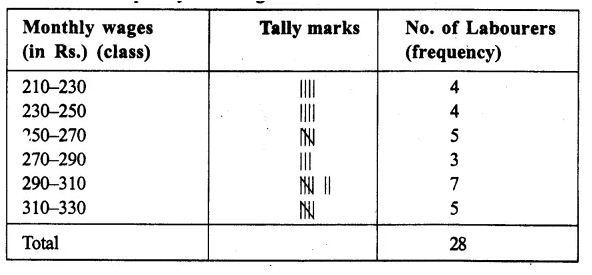
The frequency table is given below :
Question 9.
Solution:
The frequency table of given data is given below :
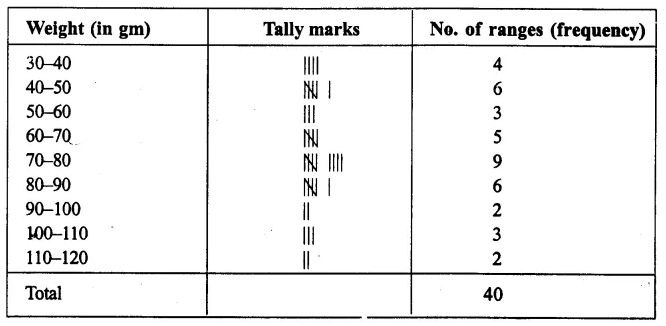
Question 10.
Solution:
The frequency distribution table of the given data in given below :
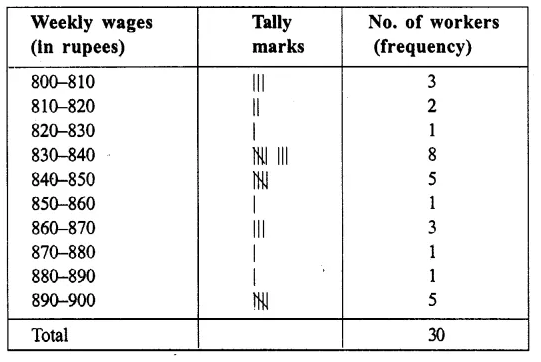
Question 11.
Solution:
The frequency table of the given data:
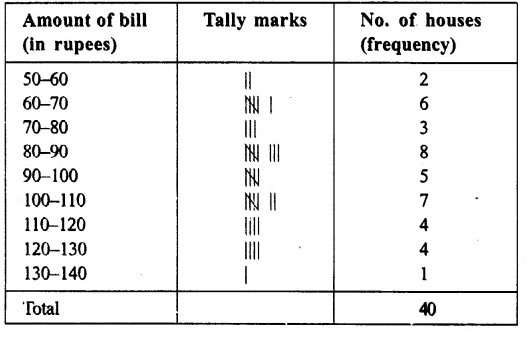
Question 12.
Solution:
The cumulative frequency of the given table is given below:

Question 13.
Solution:
The given table can be represented in a group frequency table in given below :

Question 14.
Solution:
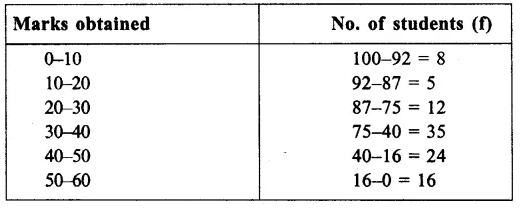
Frequency table of the given cumulative frequency is given below :
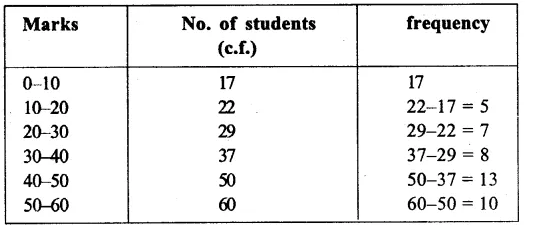
Question 15.
Solution:
A frequency table of the given cumulative frequency table is given below :
Hope given RS Aggarwal Solutions Class 9 Chapter 14 Statistics Ex 14A are helpful to complete your math homework.
If you have any doubts, please comment below. Learn Insta try to provide online math tutoring for you.