Selina Concise Mathematics Class 6 ICSE Solutions Chapter 33 Data Handling (Including Pictograph and Bar Graph)
Selina Publishers Concise Mathematics Class 6 ICSE Solutions Chapter 33 Data Handling (Including Pictograph and Bar Graph)
Data Handling Exercise 33A – Selina Concise Mathematics Class 6 ICSE Solutions
Question 1.
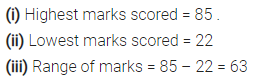
Marks scored by 30 students of class VI are as given below :
38, 46, 33, 45, 63, 53, 40, 85, 52, 75, 60, 73, 62, 22, 69, 43, 45, 33, 47, 41, 29, 43, 37, 49, 83, 44, 55, 22, 35 and 45. State :
(i) the highest marks scored.
(ii) the lowest marks scored.
(iii) the range of marks.
Solution:
Question 2.
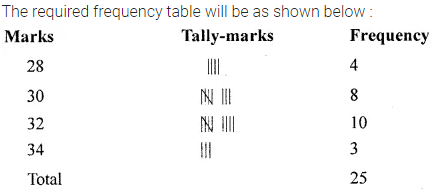
For the following raw data, form a discrete frequency distribution :
30,32,32, 28,34,34,32,30,30,32,32,34,30,32,32. 28,32,30, 28,30,32,32,30,28 and 30.
Solution:
Question 3.
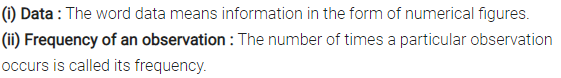
Define :
(i) data
(ii) frequency of an observation.
Solution:
Question 4.
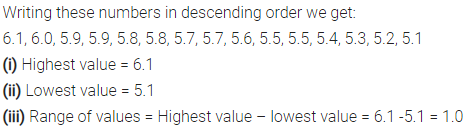
Rearranage the following raw data in descending order :
5.3, 5.2, 5.1, 5.7, 5.6, 6.0, 5.5, 5.9, 5.8, 6.1, 5.5, 5.8, 5.7, 5.9 and 5.4. Then write the :
(i) highest value
(ii) lowest value
(iii) range of values
Solution:
Question 5.
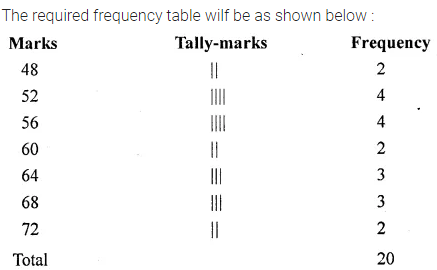
Represent the following data in the form of a frequency distribution :
52, 56, 72, 68, 52, 68, 52, 68, 52, 60, 56, 72, 56, 60, 64, 56, 48, 48, 64 and 64.
Solution:
Question 6.
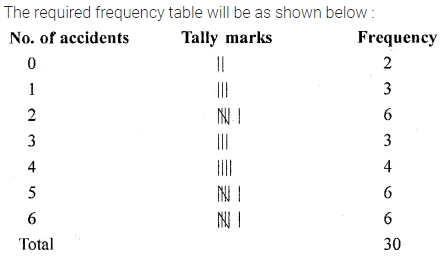
In a study of number of accidents per day, the observations for 30 days were obtained as follows :
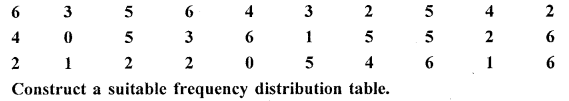
Solution:
Question 7.
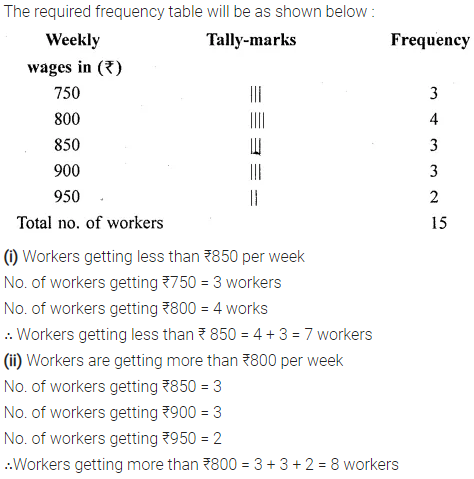
The following data represents the weekly wages (in ₹) of 15 workers in a factory : 900, 850, 800, 850, 800, 750, 950, 900, 950, 800, 750, 900, 750, 800 and 850.
Prepare a frequency distribution table. Now find,
(i) how many workers are getting less than ₹850 per week?
(ii) how many workers are getting more than ₹800 per week?
Solution:
Question 8.
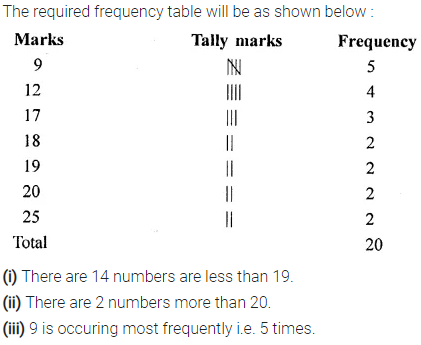
Using the data, given below, construct a frequency distribution table : 9, 17, 12, 20, 9, 18, 25, 17, 19, 9, 12, 9, 12, 18, 17, 19, 20, 25, 9 and 12. Now answer the following :
(i) How many numbers are less than 19?
(ii) How many numbers are more than 20?
(iii) Which of the numbers, given above, is occurring most frequently?
Solution:
Question 9.
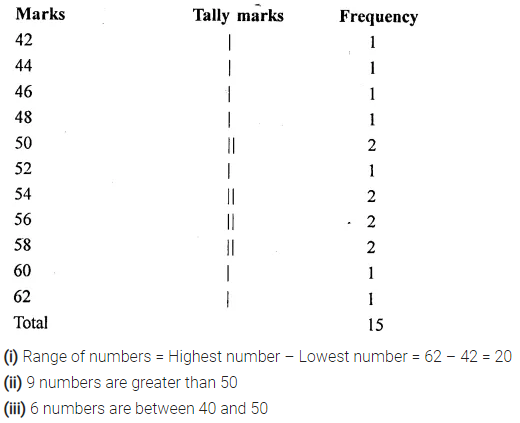
Using the following data, construct a frequency distribution table : 46, 44, 42, 54, 52, 60, 50, 58, 56, 62, 50, 56, 54, 58 and 48.
Now answer the following :
(i) What is the range of the numbers?
(ii) How many numbers are greater than 50?
(iii) How many numbers are between 40 and 50?
Solution:
Data Handling Exercise 33B – Selina Concise Mathematics Class 6 ICSE Solutions
Question 1.
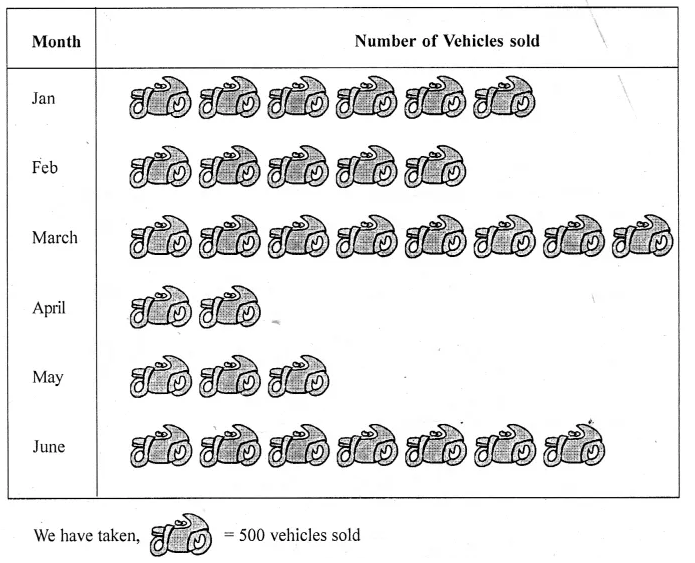
The sale of vehicles, in a particular city, during the first six months of the year 2016 is shown below :

vehicles sold
Draw a pictograph to represent the above data.
Solution:
Question 2.
Solution:
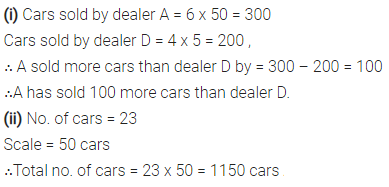
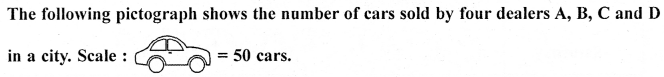
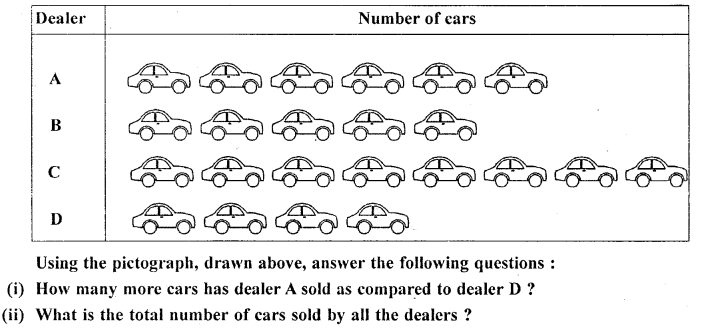
Question 3.
The following pictograph shows the number of watches manufactured by a factory, in a particular weeks.
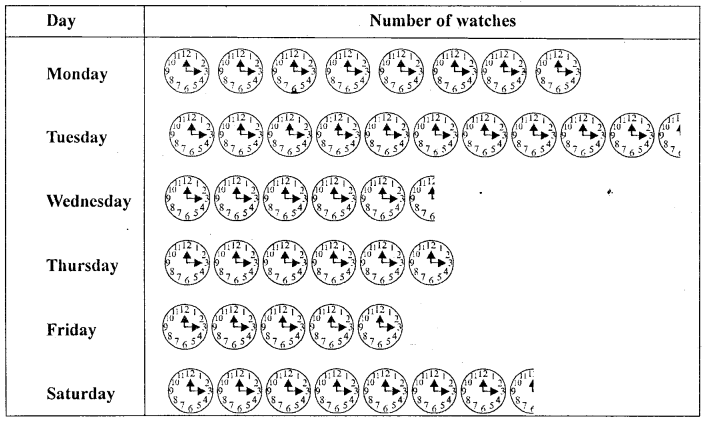
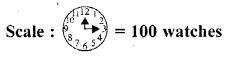
Find
(i) on which day were the least number of w atches manufactured?
(ii) total number of watches manufatured in the whole week?
Solution:

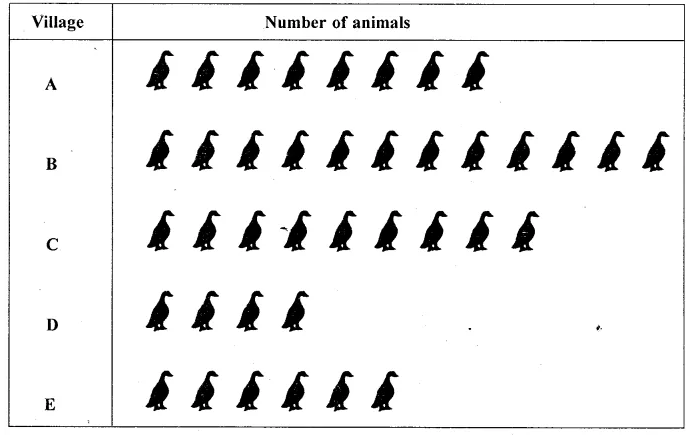
Question 4.
The number or animals in five villages are as follows :
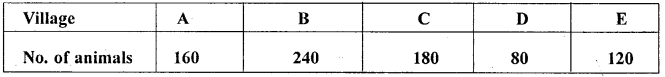
Prepare a pitctograph of these animals using one symbol to represent 20 animals.
Solution:
Question 5.
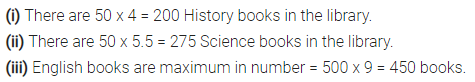
The following pictograph shows different subject books which are kept in a school library.
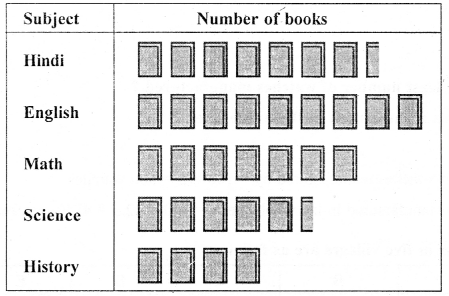
Taking symbol of one book = 50 books, find :
(i) how many History books are there in the library ?
(ii) how many Science books are there in the library ?
(iii) which books are maximum in number ?
Solution:
Data Handling Exercise 33C – Selina Concise Mathematics Class 6 ICSE Solutions
Question 1.
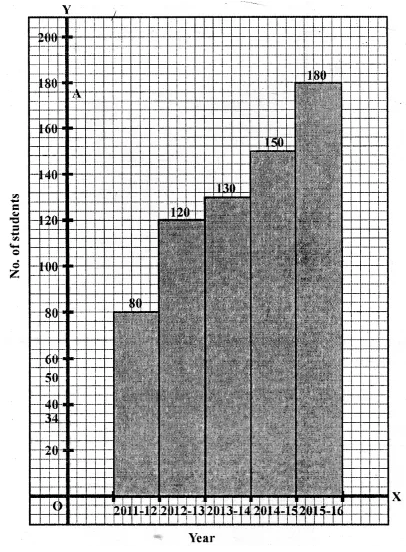
The following table gives the number of students in class VI in a school during academic years 2011-2012 to 2015-2016.
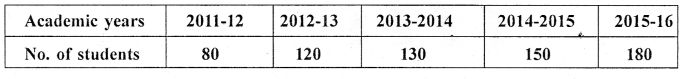
Represent the above data by a bar graph.
Solution:
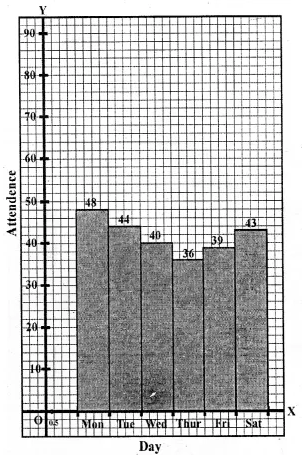
Question 2.
The attendence of a particular class for the six days of a week are as given below :
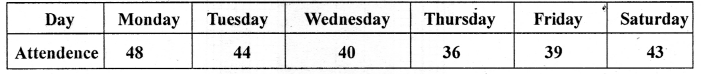
Draw a suitable graph.
Solution:
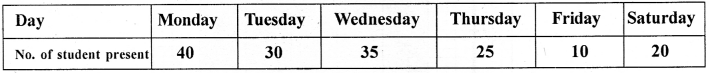
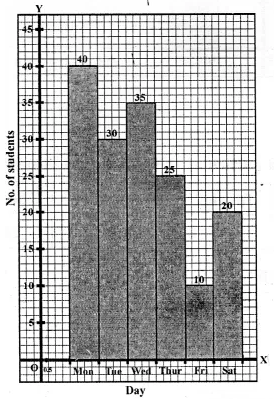
Question 3.
The total number of students present in class VI B, for the six days in a week were as given below. Draw a suitable bar graph.
Solution:
Question 4.
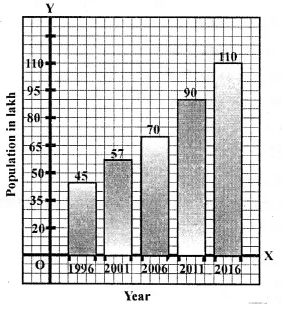
The following table shows the population of a particular city at different years :
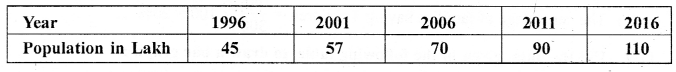
Represent the above information with the help of a suitable bar graph.
Solution:
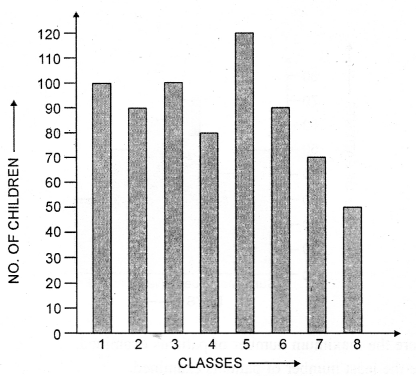
Question 5.
In a survey of 300 families of a colony, the number of children in each family was recorded and the data has been represented by the bar graph, given below :
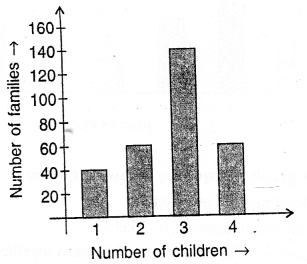
Read the graph carefully and answer the following questions :
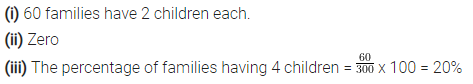
(i) How many families have 2 children each?
(ii) How many families have no child?
(iii) What percentage of families have 4 children?
Solution:
Question 6.
Use the data, given in the following table, to draw’ a bar graph
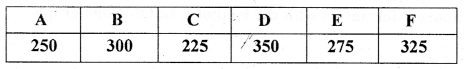
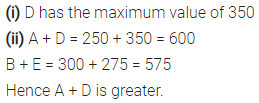
Out of A, B, C, D, E and F
(i) Which has the maximum value.
(ii) Which is greater A + D or B + E.
Solution:
Question 7.
The bar graph drawn below shows the number of tickets sold during a fair by 6 students A, B, C, D, E and F.
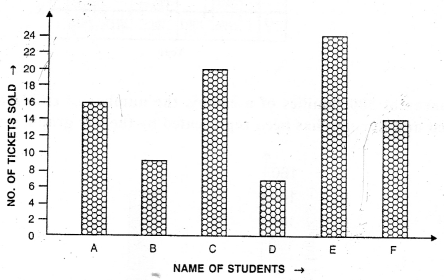
Using the Bar graph, answer the following questions :
(i) Who sold the least number of tickets?
(ii) Who sold the maximum number of tickets?
(iii) How many tickets were sold by A, B and C taken together?
(iv) How many tickets were sold by D, E and F taken together?
(v) What is the average number of tickets sold per student?
Solution:
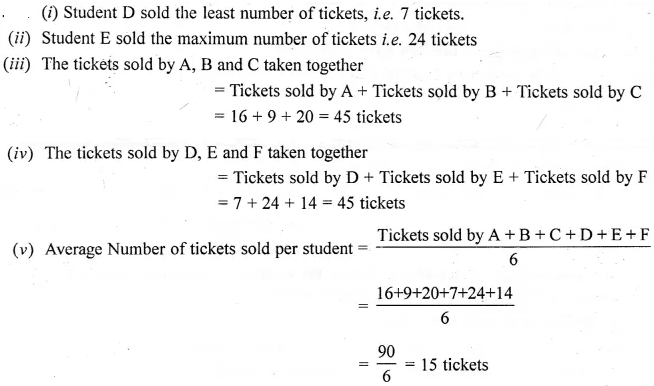
Question 8.
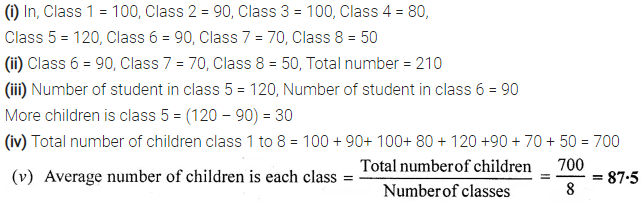
The following bar graph shows the number of children, in various classes, in a school in Delhi.
Using the given bar graph, find :
(i) the number of children in each class.
(ii) the total number of children from Class 6 to Class 8.
(iii) how many more children there are in Class 5 compared to Class 6 ?
(iv) the total number of children from Class 1 to Class 8.
(v) the average number of children in a class.
Solution:
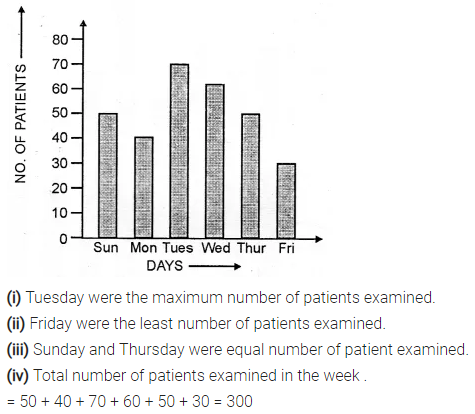
Question 9.
The column graph, given above, shows the number of patients, examined by Dr. V.K. Bansal, on different days of a particular week.
Use the graph to answer the following:
(i) On which day were the maximum number of patients examined?
(ii) On which day were the least number of patients examined?
(iii) On which days were an equal number or patients examined?
(iv) What is the total number of patients examined in the week?
Solution:
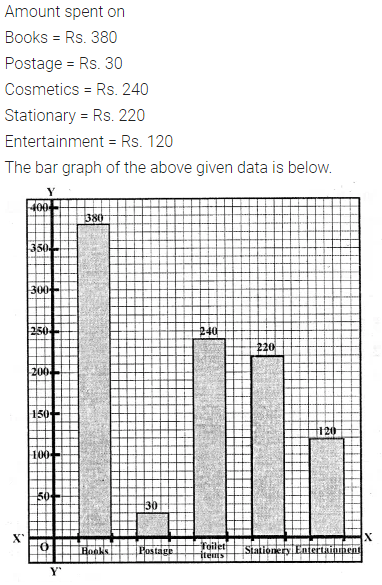
Question 10.
A student spends his pocket money on various items, as given below :
Books : Rs. 380, Postage : Rs. 30, Cosmetics : Rs. 240, Stationary : Rs. 220 and Entertainment: Rs. 120.
Draw a bar graph to represent his expenses.
Solution: