Here we are providing Online Education Statistics Class 10 Extra Questions Maths Chapter 14 with Answers Solutions, Extra Questions for Class 10 Maths was designed by subject expert teachers. https://ncertmcq.com/extra-questions-for-class-10-maths/
Online Education Extra Questions for Class 10 Maths Statistics with Answers Solutions
Extra Questions for Class 10 Maths Chapter 14 Statistics with Solutions Answers
Statistics Class 10 Extra Questions Very Short Answer Type
Statistics Class 10 Extra Questions Question 1.
Find the class mark of the class 10 – 25.
Solution:
![]()
Class 10 Statistics Extra Questions Question 2.
Find the mean of the first five natural numbers.
Solution:
![]()
Statistics Extra Questions Class 10 Question 3.
A data has 13 observations arranged in descending order. Which observation represents the median of data?
Solution:
Total no. of observations = 13, which is odd
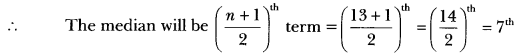
i.e., 7th term will be the median.
Extra Questions Of Statistics Class 10 Question 4.
If the mode of a distribution is 8 and its mean is also 8, then find median.
Solution:
Mode = 8; Mean = 8; Median = ?
Relation among mean, median and mode is
3 median = mode + 2 mean
3 × median = 8 + 2 × 8
Median = \(\frac{8+16}{3}\) = \(\frac{24}{3}\) = 8
Statistics Class 10 Extra Questions With Answers Pdf Question 5.
In an arranged señes of an even number of 2n terms which term is median?
Solution:
No. of terms = 2n which are even
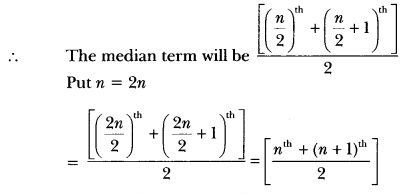
i.e., the mean of nth and (n + 1)th term will be the median.
Extra Questions On Statistics Class 10 Question 6.
What does the abscissa of the point of intersection of the less than type and of the more than type cumulative frequency curves of a grouped data represent?
Solution:
The abscissa of the point of intersection of the less than type and of the more than type cumulative frequency curves of a grouped data gives its median.
Class 10 Maths Chapter 14 Extra Questions With Solutions Question 7.
Name the graphical representation from which the mode of a frequency distribution is obtained.
Solution:
The mode of frequency distribution is determined graphically from Histogram.
Class 10 Maths Statistics Extra Questions Question 8.
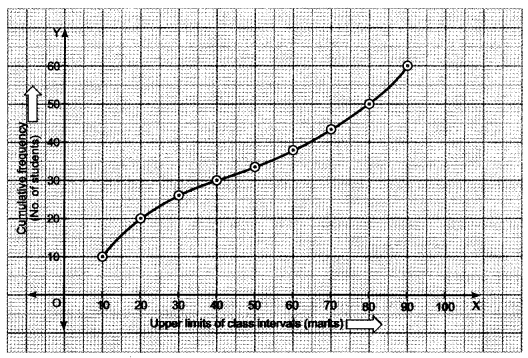
A student draws a cumulative frequency curve for the marks obtained by 60 students of a class as shown below. Find the median marks obtained by the students of the class.
Solution:
Here n = 60
\(\frac{n}{2}\) = 30
Corresponding to 30 on y-axis, the marks on x-axis is 40.
∴ Median marks = 40.
Statistics Class 10 Extra Questions With Answers Question 9.
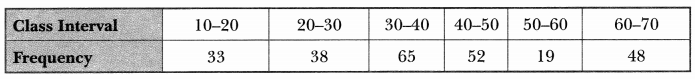
Write the modal class for the following frequency distribution:
Solution:
Maximum frequency, i.e., 65 corresponds to the class 30 – 40
∴ Modal class is 30 – 40.
Statistics Class 10 Extra Questions Short Answer Type 1
Extra Questions Of Chapter 14 Class 10 Maths Question 1.
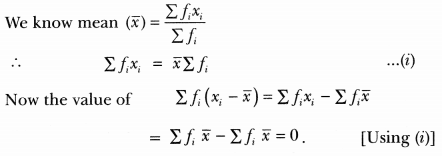
If xi‘s are the mid-points of the class intervals of a grouped data. fi‘s are the corresponding frequencies and is the mean, then find Σfi (xi – \(\bar{x}\)).
Solution:
Class 10 Statistics Important Questions Question 2.
Consider the following frequency distribution.

Solution:
Classes are not continuous, hence make them continuous by adding 0.5 to the upper limits and subtracting 0.5 from the lower limits.
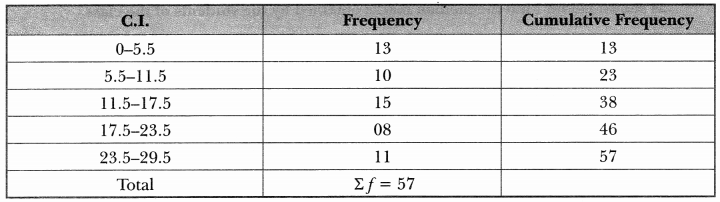
Class interval can’t be negative hence the first CI is starting from 0.
Now to find median class we calculate \(\frac{\Sigma f}{2}\) = \(\frac{57}{2}\) = 28.5
∴ Median class = 11.5 – 17.5.
So, the upper limit is 17.5
Class 10 Maths Ch 14 Extra Questions Question 3.
Find the median class of the following distribution:

Solution:
First we find the cumulative frequency
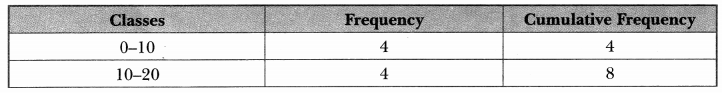
Here, \(\frac{n}{2}\) = \(\frac{50}{2}\)
∴ Median class = 30 – 40.
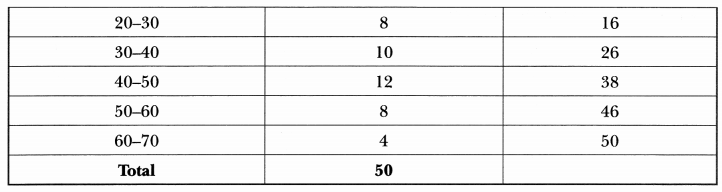
Ch 14 Maths Class 10 Extra Questions Question 4.
Find the class marks of classes 15.5 – 18.5 and 50 – 75.
Solution:
Statistics Class 10 Extra Questions Short Answer Type 2
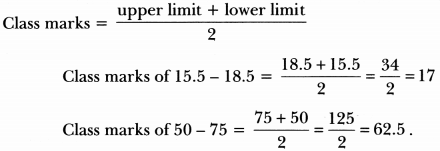
Extra Sums Of Statistics Class 10 Question 1.
If the mean of the following distribution is 6, find the value of p.

Solution:
Calculation of mean
Chapter 14 Maths Class 10 Extra Questions Question 2.
Find the mean of the following distribution:

Solution:
Calculation of arithmetic mean
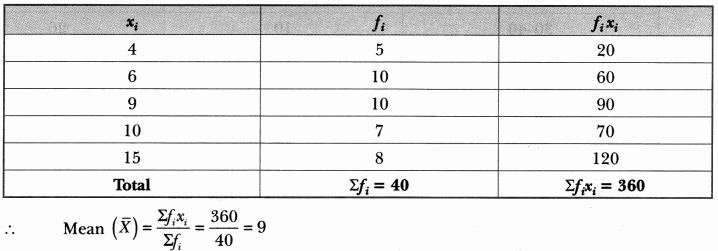
Questions On Statistics Class 10 Question 3.
The following data gives the information on the observed lifetimes (in hours) of 225 electrical components:

Determine the modal lifetimes of the components.
Solution:
Here, the maximum class frequency is 61 and the class corresponding to this frequency is 60 – 80.
So, the modal class is 60 – 80.
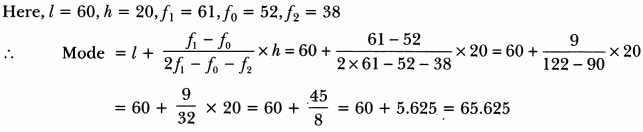
Hence, modal lifetime of the components is 65.625 hours.
Extra Questions For Class 10 Maths Statistics Question 4.
The distribution below gives the weights of 30 students of a class. Find the median weight of the students.

Solution:
Calculation of median
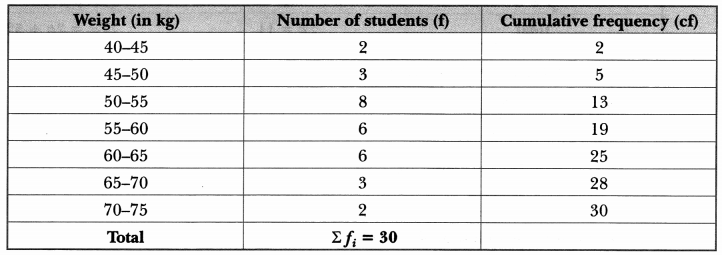
The cumulative frequency just greater than \(\frac{n}{2}\) = 15 is 19, and the corresponding class is 55 – 60.
∴ 55 – 60 is the median class.
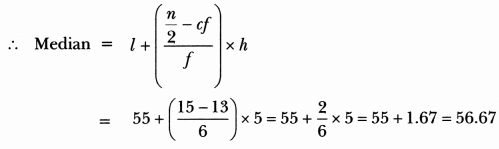
Hence, median weight is 56.67 kg.
Class 10th Statistics Extra Questions Question 5.
The lengths of 40 leaves of a plant are measured correctly to the nearest millimetre, and the data obtained is represented in the following table:
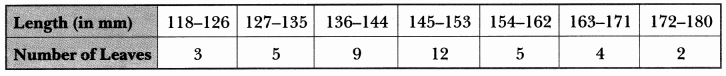
Find the median length of the leaves.
Solution:
Here, the classes are not in inclusive form. So, we first convert them in inclusive form by subtracting \(\frac{h}{2}\) from the lower limit and adding \(\frac{h}{2}\) to the upper limit of each class, where h is the difference between the lower limit of a class and the upper limit of preceding class.
Now, we have
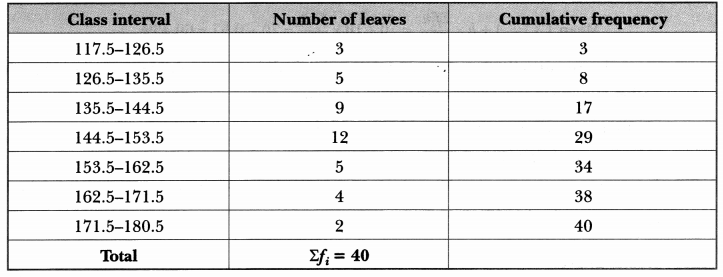
We have, n = 40
⇒ \(\frac{n}{2}\) = 20 .
And, the cumulative frequency just greater than \(\frac{n}{2}\) is 29 and corresponding class is 144.5 – 153.5.
So median class is 144.5 – 153.5.
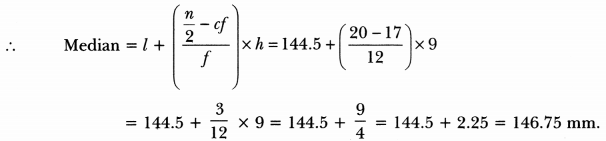
Hence, the median length of the leaves is 146.75 mm.
Statistics Class 10 Extra Questions Long Answer Type
Question 1.
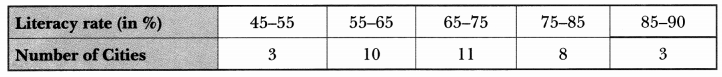
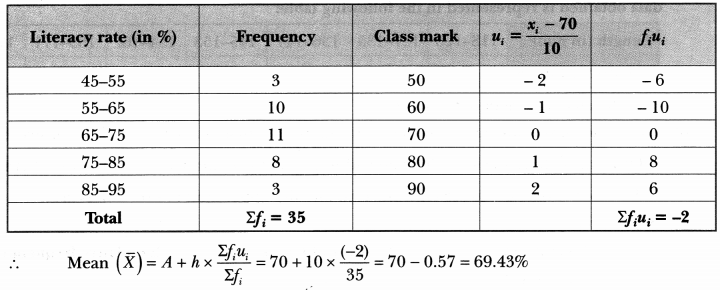
The following table gives the literacy rate (in percentage) of 35 cities. Find the mean literacy rate.
Solution:
Here, we use step deviation method to find mean.
Let assumed mean A = 70 and class size h = 10
So, ui = \(\frac{x_{i}-70}{10}\)
Now, we have
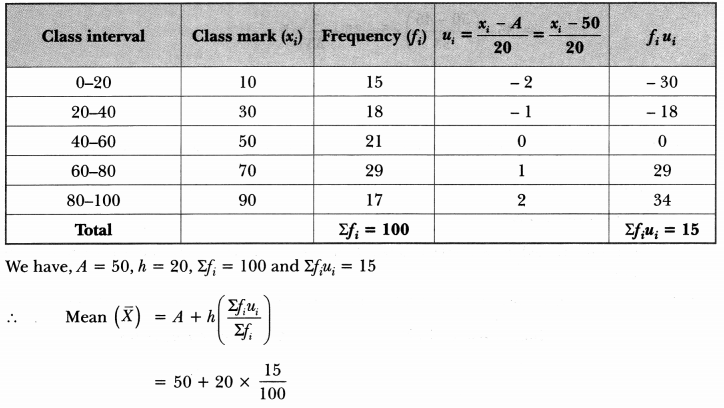
Question 2.
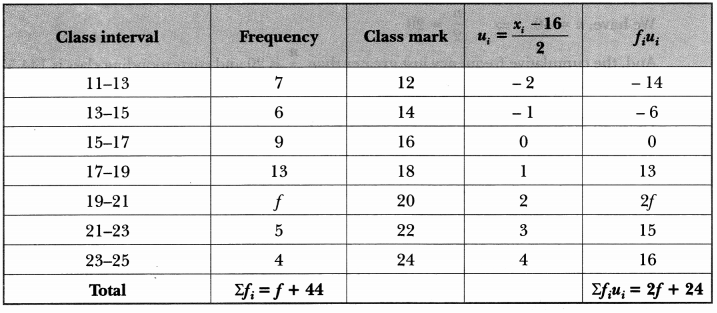
The following distribution shows the daily pocket allowance of children of a locality. The mean pocket allowance is ₹ 18. Find the missing frequency f.

Solution:
Let the assumed mean A = 16 and class size h = 2, here we apply step deviation method.
![]()
Now, we have,
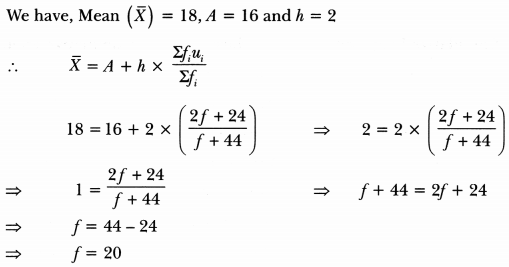
Hence, the missing frequency is 20.
Question 3.
The mean of the following frequency distribution is 62.8. Find the missing frequency x.

Solution:
We have
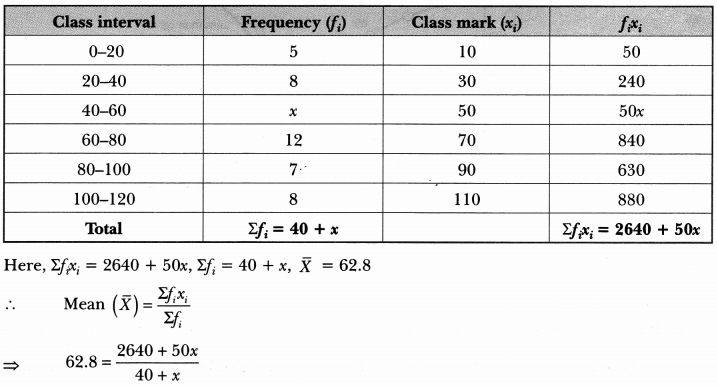
⇒ 2512 + 62.8x = 2640 + 50x
⇒ 62.8x – 50x = 2640 – 2512
⇒ 12.8x = 128
∴ x = \(\frac{128}{12.8}\) = 10
Hence, the missing frequency is 10.
Question 4.
The distribution below gives the marks of 100 students of a class.
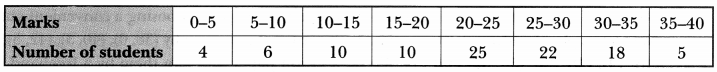
Draw a less than type and a more than type ogive from the given data. Hence, obtain the median marks from the graph.
Solution:
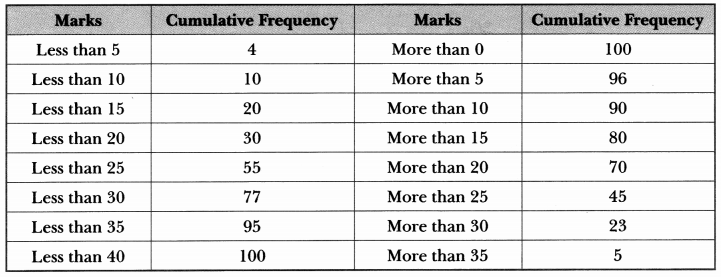
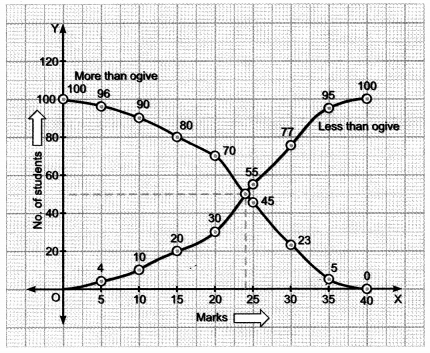
Hence, median marks = 24
Question 5.
During the medical check-up of 35 students of a class, their weights were recorded as follows:
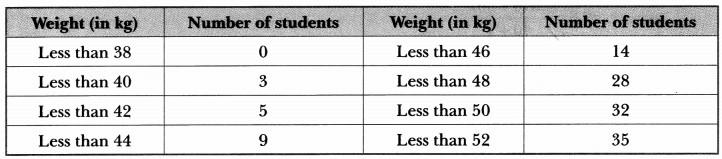
Draw a less than type ogive for the given data. Hence, obtain the median weight from the graph and verify the result by using the formula.
Solution:
To represent the data in the table graphically, we mark the upper limits of the class interval on x-axis and their corresponding cumulative frequency on y-axis choosing a convenient scale. Now, let us plot the points corresponding to the ordered pair given by (38,0), (40,3), (42,5), (44, 9), (46, 14), (48, 28), (50, 32) and (52, 35) on a graph paper and join them by a freehand smooth curve.
Thus, the curve obtained is the less than type ogive.
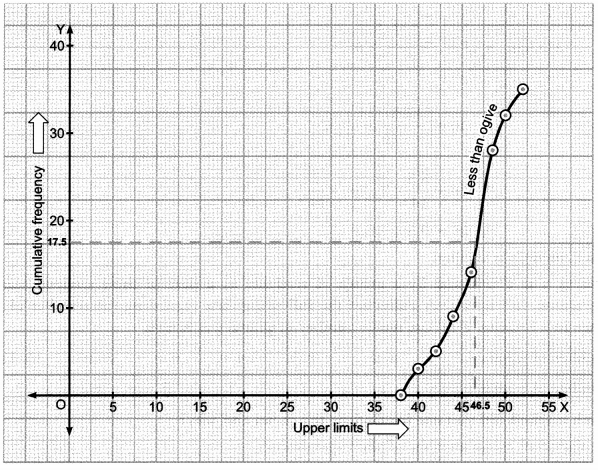
Now, locate \(\frac{n}{2}\) = \(\frac{35}{2}\) = 17.5 on the y-axis,
We draw a line from this point parallel to x-axis cutting the curve at a point. From this point, draw a perpendicular line to the x-axis. The point of intersection of this perpendicular with the x-axis gives the median of the data. Here it is 46.5.
Let us make the following table in order to find median by using formula.
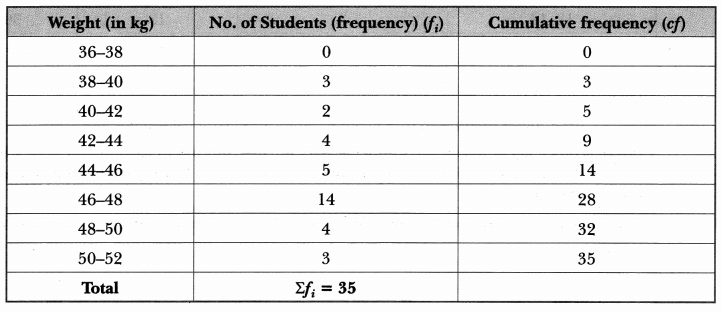
Here, n = 35, \(\frac{n}{2}\) = \(\frac{35}{2}\) = 17.5, cumulative frequency greater than \(\frac{n}{2}\) = 17.5 is 28 and corresponding class is 46 – 48. So median class is 46 – 48.
Now, we have l = 46, \(\frac{n}{2}\) = 17.5, cf = 14, f = 14, h = 2
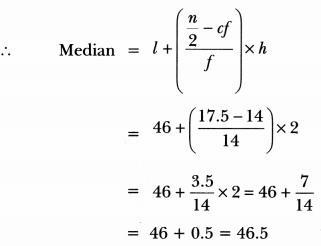
Hence, median is verified.
Question 6.
A survey was conducted by a group of students as a part of their environment awareness programme, in which they collected the following data regarding the number of plants in 20 housesin a locality. Find the mean number of plants per house.

Which method did you use for finding the mean and why?
Solution:
Calculation of mean number of plants per house.
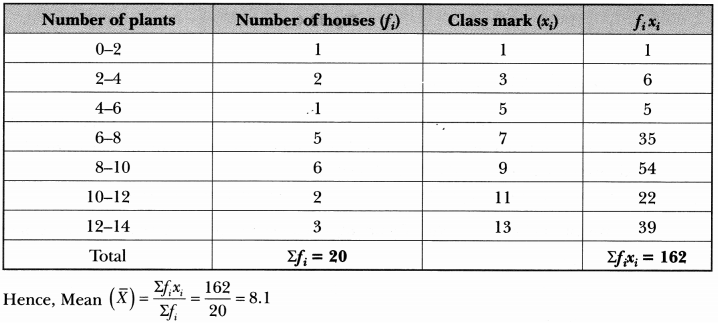
Here, we used direct method to find mean because numerical values of x; and fi are small.
Question 7.
A life insurance agent found the following data for distribution of ages of 100 policy holders. Calculate the median age, if policies are given only to persons having age 18 years onwards but less than 60 years.
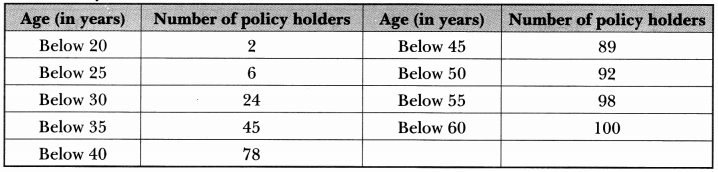
Solution:
We are given the cumulative frequency distribution. So, we first construct a frequency table from the given cumulative frequency distribution and then we will make necessary computations to compute median.
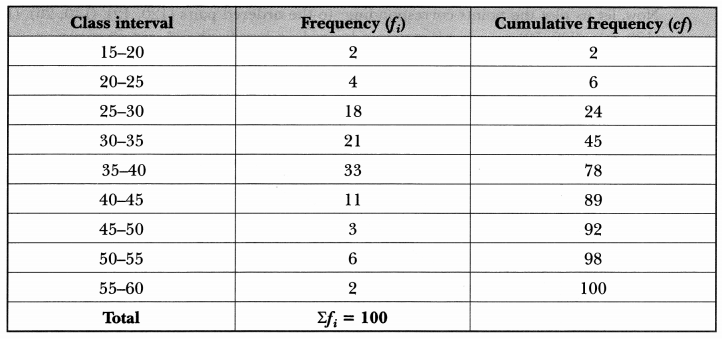
Here, n = 100
⇒ \(\frac{n}{2}\) = 50
And, cumulative frequency just greater than \(\frac{n}{2}\) 50 is 78 and the corresponding class is 35 – 40.
So 35 – 40 is the median class.
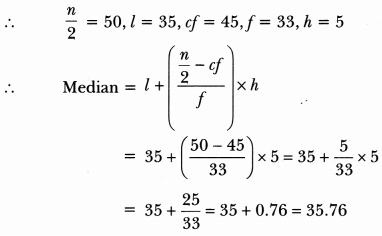
Hence, the median age is 35.76 years.
Question 8.
The following distribution gives the daily income of 50 workers of a factory.

Convert the distribution above to a less than type cumulative frequency distribution, and draw its ogive.
Solution:
Converting given distribution to a less than type cumulative frequency distribution, we have,
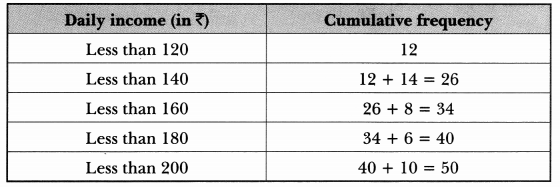
Now, let us plot the points corresponding to the ordered pairs (120, 12), (140, 26), (160, 34), (180, 40), (200, 50) on a graph paper and join them by a freehand smooth curve.
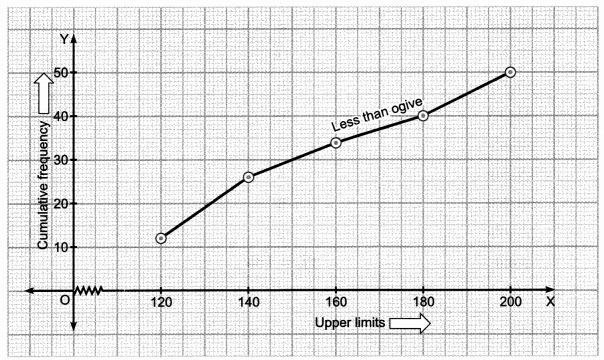
Thus, obtained curve is called the less than type ogive.
Question 9.
Find the mean of the following frequency distribution:

Solution:
Calculation of mean
Statistics Class 10 Extra Questions HOTS
Question 1.
The mean of the following frequency table is 50. But the frequencies f1 and f2 in class 20 – 40 and 60 – 80 respectively are missing. Find the missing frequencies.

Solution:
Let the assumed mean A = 50 and h = 20.
Calculation of mean
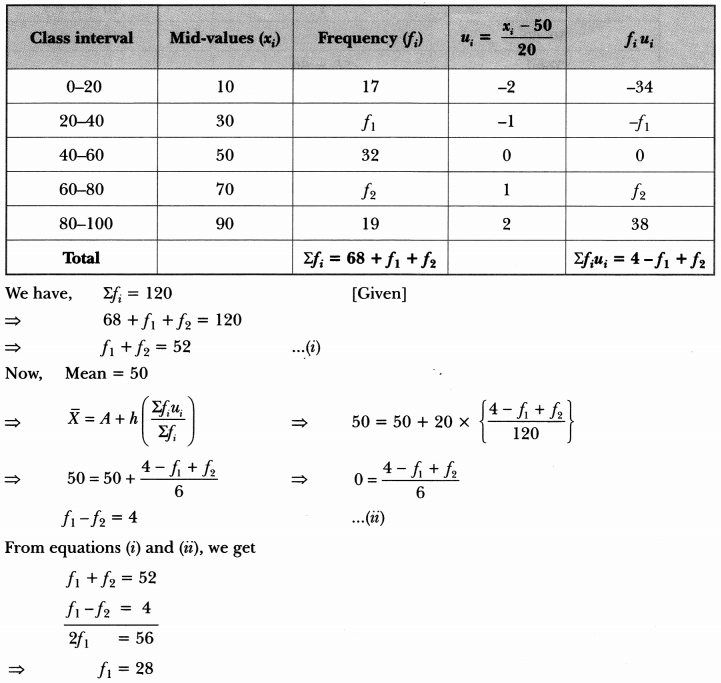
Putting the value of f1 in equation (i), we get
28 + f2 = 52
⇒ f2 = 24
Hence, the missing frequencies f1 is 28 and f2 is 24.
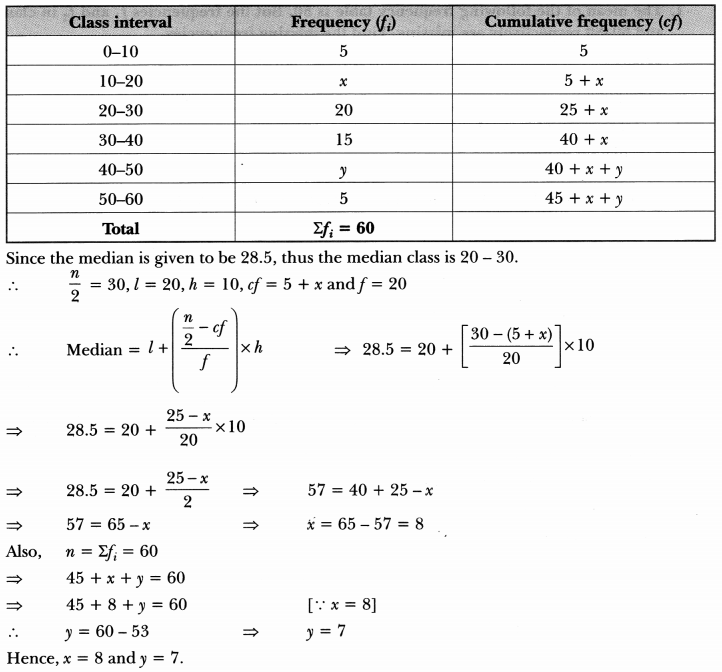
Question 2.
If the median of the distribution given below is 28.5, find the values of x and y.
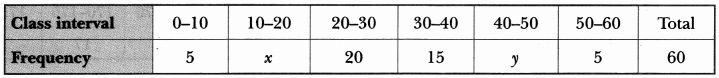
Solution:
Here, median = 28.5 and n = 60
Now, we have