Here we are providing Statistics Class 9 Extra Questions Maths Chapter 14 with Answers Solutions, Extra Questions for Class 9 Maths was designed by subject expert teachers. https://ncertmcq.com/extra-questions-for-class-9-maths/
Extra Questions for Class 9 Maths Statistics with Answers Solutions
Extra Questions for Class 9 Maths Chapter 14 Statistics with Solutions Answers
Statistics Class 9 Extra Questions Very Short Answer Type
Statistics Class 9 Extra Questions Question 1.
The points scored by a basketball team in a series of matches are follows:
17, 7, 10, 25, 5, 10, 18, 10 and 24. Find the range.
Solution:
Here, maximum points = 25 and
minimum points = 5
Range = Maximum value – Minimum value
= 25 – 5 = 20
Class 9 Statistics Extra Questions Question 2.
The points scored by a basketball team in a series of matches are as follows:
17, 2, 7, 27, 25, 5, 14, 18, 10. Find the median.
Solution:
Here, points scored in ascending order are 2, 5, 7, 10, 14, 17, 18, 25, 27, we have n = 9 terms
![]()
Statistics Class 9 Extra Questions Pdf Question 3.
The scores of an English test (out of 100) of 20 students are given below :
75, 69, 88, 55, 95, 88, 73, 64, 75, 98, 88, 95, 90, 95, 88, 44, 59, 67, 88, 99. .:: Find the median and mode of the data.
Solution:
The scores of an English test (out of 100) in ascending order are
44, 55, 59, 64, 67, 69, 73, 75, 75, 88, 88, 88, 88, 88, 90, 95, 95, 95, 98, 99
Here, n = 20
![]()
= Mean of 10th and 11th term Median
= Mean of 88 and 88 = 88
Mode = 88 [∵ 88 occured max. no. of times i.e., 5 times]
Statistics Extra Questions Class 9 Question 4.
Mean of 20 observations is 17. If in the observations, observation 40 is replaced by 12, find the new mean.
Solution:
Since mean of 20 observations is 17
∴ Sum of the 20 observations = 17 × 20 = 340
New sum of 20 observations = 340 – 40 + 12 = 312
New mean = \(\frac{312}{20}\) = 15.6
Extra Questions On Statistics Class 9 Question 5.
Mean of 36 observations is 12. One observation 47 was misread as 74. Find the correct
mean.
Solution:
Mean of 36 observations = 12
Total of 36 observations = 36 × 12 = 432
Correct sum of 36 observations = 432 – 74 + 47 = 405
Correct mean of 36 observations = \(\frac{405}{36}\) = 11.25
Class 9 Maths Chapter 14 Extra Questions Question 6.
The median of the data 26, 56, 32, 33, 60, 17, 34, 29, 45 is 33. If 26 is replaced by 62, then
find the new median.
Solution:
Here, the given data in ascending order is 17, 29, 32, 33, 34, 45, 56, 60, 62
![]()
Hence, new median is 34.
Statistics Class 9 Extra Questions With Solutions Question 7.
There are 50 numbers. Each number is subtracted from 53 and the mean of the numbers so obtained is found to be – 3.5. Find the mean of the given numbers.
Solution:
Let x be the mean of 50 numbers.
i. Sum of 50 numbers = 50x
Since each number is subtracted from 53.
According to question, we have

Class 9 Maths Statistics Extra Questions Question 8.
To draw a histogram to represent the following frequency distribution :

Find the adjusted frequency for the class 25-45.
Solution:
Adjusted frequency of a class

Statistics Class 9 Extra Questions Short Answer Type 1
Extra Questions Of Statistics Class 9 Question 1.
For a particular year, following is the distribution of ages (in years) of primary school teachers in a district :

(i) Write the lower limit of first class interval.
(ii) Determine the class limits of the fourth class interval.
(iii) Find the class mark of the class 45 – 50.
(iv) Determine the class size.
Solution:
(i) First class interval is 15 – 20 and its lower limit is 15.
(ii) Fourth class interval is 30 – 35
Lower limit is 30 and upper limit is 35.
(iii) Class mark of the class 45 – 50 = \(\frac{45+50}{2}\) = \(\frac{95}{2}\) = 47.5
(iv) Class size = Upper limit of each class interval – Lower limit of each class interval
∴ Here, class size = 20 – 15 = 5
Statistics Class 9 Important Questions Question 2.
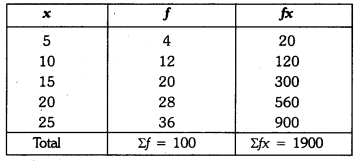
Find the mean of the following distribution :

Solution:
![]()
Class 9 Maths Ch 14 Extra Questions Question 3.
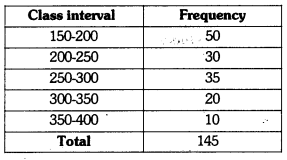
In figure, there is a histogram depicting daily wages of workers in a factory. Construct the frequency distribution table.
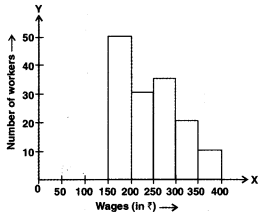
Solution:
Questions On Statistics Class 9 Question 4.
Ten observations 6, 14, 15, 17, x + 1, 2x – 13, 30, 32, 34, 43 are written in ascending
order. The median of the data is 24. Find the value of x.
Solution:
Here, the arranged data is 6, 14, 15, 17, x + 1, 2x – 13, 30, 32, 34, 43
Total number of observations = 10

But median of data is 24 (given)
⇒ \(\frac{3 x-12}{2}\) = 24
⇒ 3x – 12 = 48
⇒ 3x = 60
⇒ x = 20
∴ The value of x = 20
Statistics Class 9 Extra Questions Short Answer Type 2
Chapter 14 Maths Class 9 Extra Questions Question 1.
Draw a histogram for the given data :
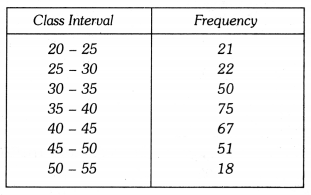
Solution:
Let us represent class-intervals along x-axis and corresponding frequencies along y-axis on
a suitable scale, the required histogram is as under :
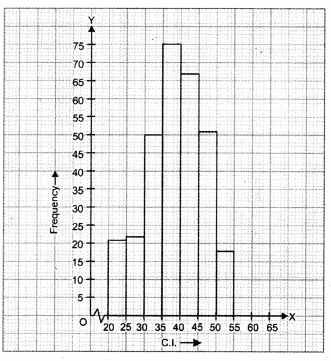
Question 2.
Given are the scores (out of 25) of 9 students in a Monday test :
14, 25, 17, 22, 20, 19, 10, 8 and 23
Find the mean score and median score of the data.
Solution:
Ascending order of scores is :
8, 10, 14, 17, 19, 20, 22, 23, 25

Question 3.
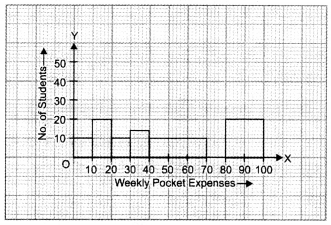
Draw a histogram of the weekly pocket expenses of 125 students of a school given below :
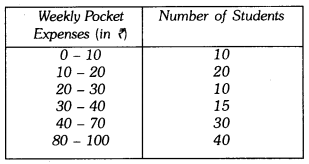
Solution:
Here, the class sizes are different, so calculate the adjusted frequency for each class by using the formula.
Minimum class size Frequency density or adjusted frequency for a class
![]()
Here, the minimum class size = 10 – 0 = 10
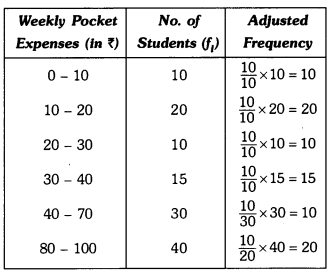
Let us represent weekly pocket money along x-axis and corresponding adjusted frequencies along y-axis on a suitable scale, the required histogram is as given below :
Question 4.
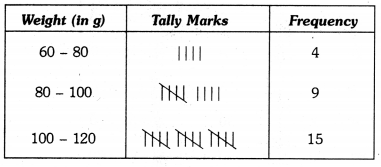
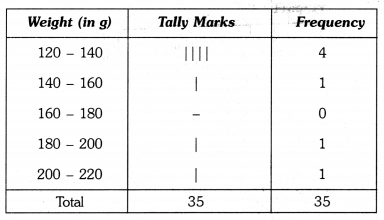
The weight in grams of 35 mangoes picked at random from a consignment are as follows:
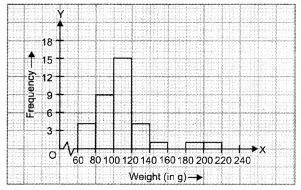
131, 113, 82, 75, 204, 81, 84, 118, 104, 110, 80, 107, 111, 141, 136, 123, 90, 78, 90, 115, 110, 98, 106, 99, 107, 84, 76, 186, 82, 100, 109, 128, 115, 107, 115 From the grouped frequency table by dividing the variable range into interval of equal width of 20 grams, such that the mid-value of the first class interval is 70 g. Also, draw a histogram.
Solution:
It is given that the size of each class interval = 20 and the mid-value of the first class interval is 70.
Let the lower limit of the first class interval be a, then its upper limit = a + 20.
\(\frac{a+(a+20)}{2}\) = 70
⇒ a = 70 – 10 = 60
Thus, the first class interval is 60 – 80 and the other class-intervals are 80 – 100, 100 – 120, 120 – 140, 140 – 160, 160 – 180, 180 – 200 and 200 – 220.
So, the grouped frequency table is as under :
Let us represent weight (in g) along x-axis and corresponding frequencies along y-axis on a suitable scale, the required histogram is as under :
Statistics Class 9 Extra Questions Long Answer Type
Question 1.
Find the mean salary of 60 workers of a factory from the following table :
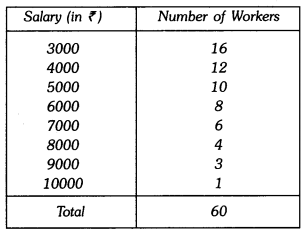
Solution:
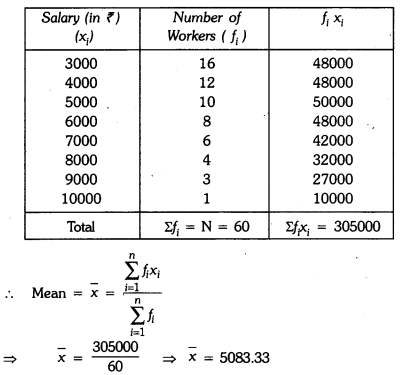
Hence, mean salary of 60 workers is ₹5083.33.
Question 2.
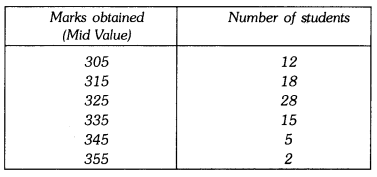
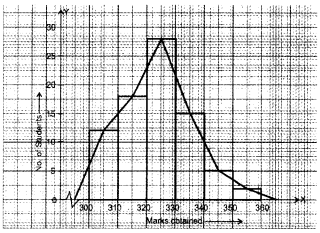
In a school marks obtained by 80 students are given in the table. Draw a histogram. Also,
make frequency polygon.
Solution:
∴ Lower limit of first class interval is 305 – \(\frac{10}{2}\) = 300
Upper limit of first class interval is 305 + \(\frac{10}{2}\) = 310
Thus, first class interval is 300 – 310
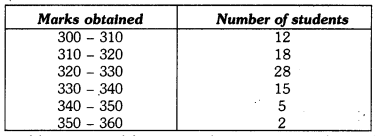
Required histogram and frequency polygon is given on the graph paper.
Question 3.
The following two tables gives the distribution of students of two sections according to the marks obtained by them :
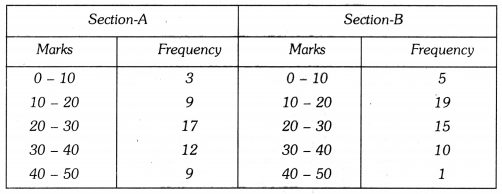
Represent the marks of the students of both the sections on the same graph by two frequency polygons. From the two polygons compare the performance of the two sections.
Solution:
The class marks are as under :

Let us take class marks on X-axis and frequencies on Y-axis. To plot frequency polygon of Section-A, we plot the points (5, 3), (15, 9), (25,17), (35,12), (45, 9) and join these points by (15,19). line segments. To plot frequency polygon of Section-B, we plot the points (5, 5), (15, 19), (25, 15), (35, 10), (45, 1) on the same scale and join these points by dotted line segments.
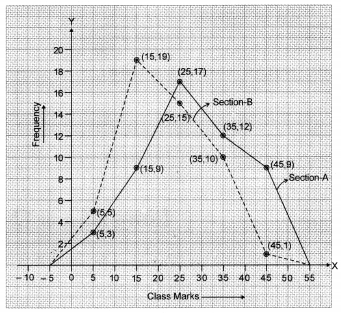
From the above two polygons, clearly the performance of Section A is better.
Statistics Class 9 Extra Questions HOTS
Question 1.
The mean weight of 60 students of a class is 52.75 kg. If mean weight of 25 students of this class is 51 kg, find the mean weight of remaining 35 students of the class.
Solution:
Total weight of 60 students = 60 × 52.75 kg = 3165 kg
Total weight of 25 students = 25 × 51 kg = 1275 kg
∴ Total weight of 35 students = (3165 – 1275) kg = 1890 kg
∴ Mean weight of 35 students = \(\frac{1890}{35}\) = 54 kg
Question 2.
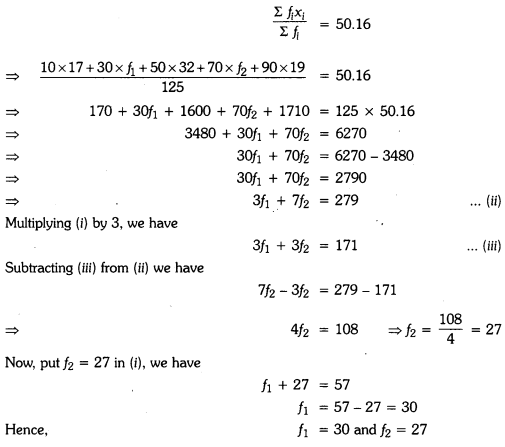
Find the missing frequencies in the following frequency distribution. If it is known that the mean of the distribution is 50.16 and the total number of items is 125.

Solution:
Since total number of items = 125
∴ 17 + f1 + 32 + f1 + 19 = 125
f1 + f2 = 125 – 17 – 32 – 19
f1 + f2 = 57 …..(i)
Now, mean of data = 50.16
We know that
Statistics Class 9 Extra Questions Value Based (VBQs)
Question 1.
The following data on the number of girls (to the nearest ten) per thousand boys in different sections of the Indian society is given below :
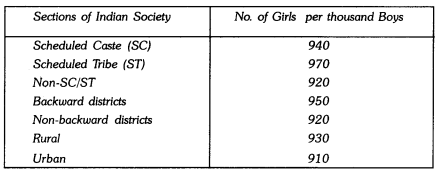
(i) Represent the information above by a bar graph.
(ii) In the classroom, discuss what conclusions can be arrived at from the graph.
(iii) What steps should be taken to improve the situation ?
Solution:
(i) The required graph is given below :
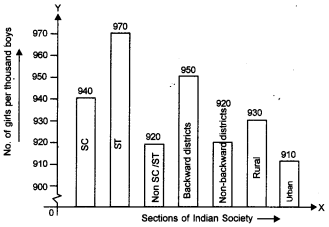
In the graph, different sections of the society is taken on X-axis and number of girls per thousand boys is taken on the Y-axis.
[Scale : 1 cm = 10 girls.]
(ii) From the graph, the number of girls to the nearest ten per thousand boys are maximum in scheduled tribes whereas they are minimum in urban.
(iii) Pre-natal sex determination should strictly banned in urban.
Question 2.
Shimpi, a class IX student received cash award of 10000 (Ten thousand) in the singing competition. Her father advised her to make a budget plan for spending this amount. She
made the following plan :
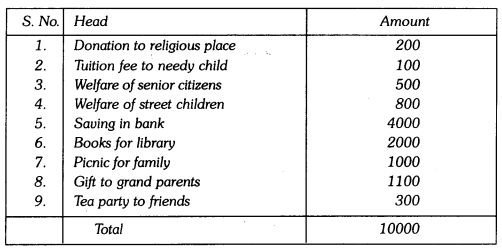
Make a bar graph for the above data.
From above answer the following questions :
(i) Which mathematical concepts have been covered in this ?
(ii) How will you rate her budget plan ? In your opinion which head has been given
(a) more than deserved and (b) less than it deserved ?
(iii) Which values are depicted in her plan?
Solution:
The bar graph of given data is given below :
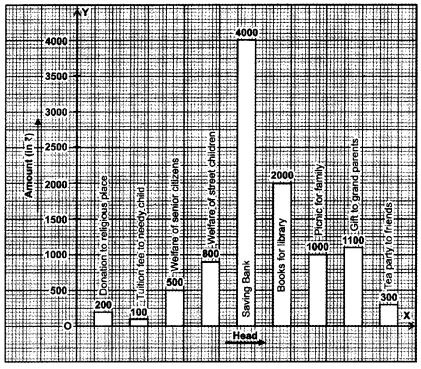
In the graph, head is taken on X-axis and amount is taken on Y-axis.
(i) Representation of data using bar graph.
(ii) Very good
(a) Picnic for family
(b) Tuition fee for needy child
(iii) Help the needy people and respect the elders.
