On this page, you will find Statistics Class 9 Notes Maths Chapter 14 Pdf free download. CBSE NCERT Class 9 Maths Notes Chapter 14 Statistics will seemingly help them to revise the important concepts in less time.
CBSE Class 9 Maths Chapter 14 Notes Statistics
Statistics Class 9 Notes Understanding the Lesson
There are two types of data:
- Primary
- Secondary.
We can represent the data by:
- Ungrouped and
- Grouped frequency distribution.
Data can also be represented by:
- Bar graph
- Histogram
- Frequency polygons.
Class mark of grouped data
\(=\frac{\text { lower limit }+\text { upper limit }}{2}\)
Measure of central tendencies are mean, median and mode.
Mean:
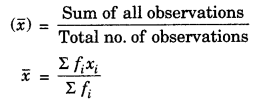
where, Σfixi = Sum of all observations
Σfi = Total frequency.
Median: Arrange the observations in ascending or descending order,
(i) If numbers of observations (x) are odd, then median \(\left(\frac{n+1}{2}\right)^{t h}\) terms
(ii) If number of observations (x) are even, then median \(\frac{n^{t h}}{2} \text { and }\left(\frac{n}{2}+1\right)^{t h}\)
Mode: The observation whose frequency is highest.
Relationship between mean, median and mode:
Mode = 3 Median – 2 Mean.
Graphical Representation of Data
- Bar graphs: A bar graph is a pictorial representation of the numerical data by a number of bars (rectangles) of uniform width erected horizontally or vertically with equal space between them. Each rectangle or bar represents only one value of the numerical data and the height or length of bar indicates the corresponding value of the numerical data.
- Histogram: A histogram or frequency histogram is a representation of a frequency distribution in the form of rectangles such that there is no gap between any two successive rectangles.
- Frequency polygon: It is another method of representing frequency distribution graphically.