By going through these CBSE Class 12 Accountancy Notes Chapter 9 Analysis of Financial Statements, students can recall all the concepts quickly.
Analysis of Financial Statements Notes Class 12 Accountancy Chapter 9
Meaning of Financial Statement Analysis: The process of critical examination of the financial information contained in the financial statements in order to understand and make decisions regarding the operations of the firm is called the ‘Financial Statement Analysis’.
Basically, it is a study of the relationship among various financial facts and figures as given in a set of financial statements.
→ “Financial statement analysis is designed to indicate the strength and weaknesses of business undertaking through the establishment of certain crucial relationship by regrouping and analysis of figures contained in financial statements.” —J.N. Myres
→ “Financial statement analysis is a judgemental process which aims to estimate current and past financial position and the results of the operations of enterprises with the primary objective of determining the best possible estimated and predictions about future conditions.” —Bernstein
Thus, Analysis of Financial Statements is the process of identifying the financial strengths and weaknesses of the firm by properly establishing a relationship between the items of the Balance Sheet and Income Statement.
The term ‘Financial Analysis’ includes both ‘analysis and interpretation’. The term analysis means simplification of financial data by the methodical classification given in the financial statements. Interpretation means explaining the meaning and significance of the data so simplified.
Significance of Financial Analysis: As we know that Financial Analysis is the process of identifying the financial strengths and weaknesses of the firm by properly establishing relationships between the items of the Balance Sheet and the Profit and Loss Account.
It can be undertaken by the management of the firm, or by parties outside the firm like Creditors, Lenders, Investors, Unions, etc. The nature and technique used for analysis will differ depending on the interests of the analysis.
Financial Analysis is useful and significant to different users in the following way:
1. To The Finance Manager: Financial Analysis focuses on the facts and relationships related to managerial performance, corporate efficiency, financial strengths and weaknesses, and credit worthiness of the company. The Finance Manager has to make rational decisions for the firm, so he must be well equipped with the different tools for analysis. These tools help him in studying accounting data, so as to determine the continuity of the operating policies, the investment value of the business.
Credit rating and testing the efficiency of operations. The technique is equally important in the area of financial control, enabling the Finance Manager to make constant reviews of the actual financial operations of the firm as a whole and in part, to analyze the cause of major deviations, which result in corrective action wherever indicated.
2. To The Management: It is the responsibility of the management to see that the resources of the firm are used most efficiently and that the firm’s financial condition is sound.
Financial analysis helps the management in measuring the success or otherwise of the company’s operations, appraising the individual’s performance, and evaluating the system of internal control.
3. To The Trade Creditors: Trade Creditors are particularly interested in the firm’s ability to meet their claims over a very short period of time. Their analysis will, therefore, confine to the evaluation of the firm’s liquidity position.
4. To The Lenders: Lenders are mainly concerned with the firm’s long-term solvency and survival. They analyze the firm’s profitability over time, its ability to generate cash to be able to pay interest and repay principal, and the relationship between various sources of funds. They do analyze the historical financial statements as well as projected financial statements to make an analysis about its future solvency and profitability.
5. To The Investors: Investors who invested their money in the firm’s shares, are interested to know about the firm’s earnings. They mainly concentrate on the analysis of the firm’s present and future profitability. The investors evaluate the efficiency of the management and determine whether a change is needed or not. In large companies, the shareholder’s interest is limited to decide whether to buy, sell or hold the shares.
6. To The Labour Unions: They analyze the Financial Statements to assess whether the company is earning a fair rate of return on invested capital, whether it can presently afford a wage increase and whether it can absorb a wage increase through increased productivity or by rising the prices.
7. To the Economists, Government, etc.: The economists, researchers analyze the Financial Statements to study the present business and economic conditions. The Government agencies need financial analysis for price regulations, tax fixation, and another similar purpose.
Purpose or Objectives of Financial Statement Analysis: Financial Statement Analysis reveals important facts and relationships concerning the managerial performance and the efficiency of the firms. The main objectives of the analysis are to understand the information contained in financial statements with a view to knowing the weaknesses and strengths of the firms and making a forecast about the future prospects of the firm and thereby enabling the financial analysis to take different decisions regarding the operations of the firm.
The following are generally considered to be the objectives of analysis:
- To find out the financial stability and soundness of the business enterprises.
- To assess and evaluate the earning capacity of the business.
- To estimate and evaluate the Fixed Assets, Stock, etc. of the concern.
- To estimate and determine the possibilities of future growth of the business.
- To assess and evaluate the firm’s capacity and ability to repay short-term and long-term loans.
- To evaluate the administrative efficiency of the business enterprises.
Tools of Financial Analysis.
- Comparative Statement Analysis.
- Common Size Statement Analysis.
- Trend Analysis.
- Ratio Analysis.
- Cash Flow Analysis.
1. Comparative Statement Analysis: Comparative statements compares financial numbers at two points of time and helps in deriving meaningful conclusions regarding the changes in financial positions and operating results and to enable the reader to understand the significance of such changes.
Such comparison of Financial Statements is accomplished by setting up a Balance Sheet and Profit and Loss Account side by side and studying the changes that have occurred in the individual figure therein from year to year and over the years. Thus, Comparative Statements are those which summarise and present relating data for a number of years incorporating therein the changes in individuals items of Financial Statements. This analysis is also known as Florizontal Analysis.
2. Common Size Statement Analysis: These Statements indicate the relationship of different items of Financial Statements with some common item by expressing each item as a percentage of the common item. The percent thus calculated can be easily compared with the corresponding percentages of some other firms, as the number is brought to a common base. This analysis is also known as ‘Vertical Analysis’.
3. Trend Analysis: It is a technique of studying several Financial Statements over a series of years. Using the previous years’ data of a business enterprise, trend analysis can be done to observe the percentage changes over time in the selected data. Trend analysis is important because, with its long-run view, it may point to basic changes in the nature of the business. By looking at a trend in a particular ratio, one may find whether the ratio is falling, rising, or remaining relatively constant.
4. Ratio Analysis: Accounting ratios measure the comparative significance of the individual items of the income and position statements. It is possible to assess the profitability, solvency, and efficiency of an enterprise through the techniques of ratio analysis.
5. Cash Flow Analysis: It refers to the analysis of the actual movement of cash in and out of an organization. Cash Flow Statements is prepared to project the manner in which the cash received has been utilized during an accounting year. It is a statement, which shows the sources of cash receipts and also the purposes for which payments are made. Thus, it summarises the causes for the changes in the cash position of a business enterprise between the dates of two Balance Sheets.
Comparative Financial Statements Analysis: Financial Statements include Income Statements (Trading and Profit and Loss A/c) and Position Statement (Balance Sheet). The study of financial statements with a view to indicating the trend of the profitability, efficiency, and financial soundness of the business is known as a comparison of financial statements.
Purpose:
- To study the magnitude and direction of changes in the financial position and performance of the enterprise.
- To ascertain the strengths and weaknesses of the enterprise in terms of liquidity, solvency, and profitability.
Importance:
- Inter-period and/or inter-firm comparisons are very much facilitated by such comparative statements. t
- With the help of Comparative Statements, weakness in the operating cycle, financial health, etc. can be identified and suitable remedial steps may be taken.
- These statements highlight the trends in a number of accounting data relating to performance, efficiency, and financial position which are useful for future estimates.
- The Profit and Loss A/c of a business show the result of operation while a Comparative Balance Sheet shows the effect of operations on its assets and liabilities. Thus, the Comparative Balance Sheet contains a connecting link between Balance Sheet and Profit and Loss A/c.
Comparative Balance Sheet: In the comparative balance sheet, the items and data of balance sheets prepared at two different dates are presented in such a way that the changes in each item between two dates are easily found out and determined.
→ “Comparative balance sheet is the study of the trend of the same item, group of items and computed items in two or more balance sheets of the same business enterprise on different dates.”—Prof. Foulkes.
Comparative Profit and Loss Account: A comparative income statement is prepared to show the net profit or loss for a number of years in comparative form. A comparative study of Income Statements for more than one period may enable us to have definite knowledge about the progress of the business concern.
Steps:
The following steps may be followed to prepare the comparative statements:
1. Draw a table with the five columns like;
Comparative Statement
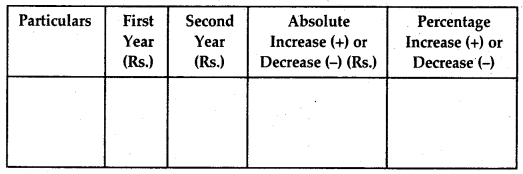
2. List out absolute figures in rupees at two different points of time.
3. Find out the change in absolute figures by subtracting the first year from the second year and indicate the change as an increase (+) or decrease (-).
4. Calculate the Percentage change as:
\(\frac{\text { SecondyearabsoluteFigure }}{\text { First year absoluteFigure }}\) × 100 – 100
Common-Size Financial Statement Analysis: Common-Size Statement also known as a component percentage statement, is a financial tool for studying the key changes and trends in the financial position (Balance Sheet) and financial result (Profit and Loss A/c) of a company.
These figures reported are converted into percentages of some common base. For example, total assets may be chosen as a measured size for the Balance Sheet and sales may act as a measured size for Profit and Loss A/c.
These statements are known as common size statements because all the figures are converted into a common size.
Purpose: An analysis of the common size statement will help better to understand the important changes which have occurred in the enterprise over a period of time. This analysis constitutes a vertical study within one column of the comparative statement therefore, it is also called vertical analysis.
Importance: An analysis of common size statement is of immense use which comparing business enterprise which differs substantially in size as it provides an insight into the structure of financial statements.
Common Size Balance Sheet
In Common Size Balance Sheet, each item of assets is shown as a percentage of total assets and each item of liability is shown as a percentage of total liabilities. The total of the assets and that of liabilities is taken as 100 percent and each item, appearing on the assets side as well as liabilities side is shown as the proportion of the total of 100. It is known as the Percentage Balance Sheet.
Common Size Income Statement: Income Statements are reduced to common size by expressing each item as a percentage of net sales. Thus the common size Income Statement captures the relationship between sales and expenses.
Steps:
The following steps may be followed to prepare the common size statements:
1. Draw a table with the five columns.
Common Size Statements
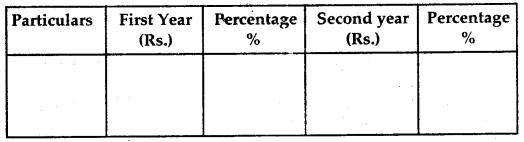
2. List out absolute figures in rupees at two different points in time.
3. Choose a common base (as 100) for example, Sales revenue total may be taken as a base (100) in case of Profit and Loss A/c and total assets or total liabilities (100) in case of Balance Sheet.
4. Convert all items of Col. 2 and Col. 4 as a percentage of that total. Columns 3 and 5 portray these percentages.
The purpose of the common-size analysis is to know the importance of each item in the total. Hence, this analysis can be done for one year also.
Trend Analysis: The Financial Statements may be analyzed by computing trends emeries of information. Trend analysis determines the direction upwards or downwards and involves the computation of the percentage relationship that each item bears to the same item in the base year. In Trend Analysis, we would like to know the behavior of some item over the period, say during the last 5 years.
In other words, Comparative and Common Size Statements present the percentage of each item to the total sum. These percentages could be calculated for a number of successive years in order to understand the trend of the Financial Statement item and this analysis is called trend analysis.
The trend in general term signifies a Tendency. The review and appraisal of tendency in accounting data are nothing but trend analysis. It discloses the change in the financial and operating data between specific period and makes possible for the analyst to form an opinion as to whether favorable or unfavorable tendencies are reflected by the accounting data.
Purpose and Importance:
1. It helps in future forecasts of various items as the basis of data of the previous year.
2. In this method, mass complex accounting data are converted into % and presented in brief, so the direction of the business can be easily detected.
3. There is less chance of mistakes because changes in percentages can be compared to changes in absolute data.
4. It is a very easy method to calculate that even a layman can also use this method.
Procedure: Generally, the first or the last year is taken as the base year. The figure for the base year is taken as 100. The trend percentages are calculated in relation to this base year. Each year’s figure is divided by the base year figure.
Trend Percentage = \(\frac{\text { Present year value }}{\text { Base year value }}\) × 100
The base period should be carefully selected. The accounting procedures and conventions used for collecting data and preparation of Financial Statements should be similar, otherwise, the figures will not be compared.
Limitations of Financial Analysis
Though financial analysis is quite powerful in determining the financial strengths and weaknesses of a firm, the analysis is based on the information available in financial statements. As such, financial analysis also suffers from the serious limitations of financial statements.
Some other limitations of financial analysis are:
- It does not consider price level changes.
- It may be misleading an account of changes in accounting procedure followed by a firm.
- It is just a study of interim reports.
- Monetary information alone is considered in financial analysis while non-monetary factors are ignored.
- The financial statements are prepared on the basis of ongoing concepts as such, it does not give an exact position.