ML Aggarwal Class 10 Solutions for ICSE Maths Chapter 21 Measures of Central Tendency Ex 21.1
These Solutions are part of ML Aggarwal Class 10 Solutions for ICSE Maths. Here we have given ML Aggarwal Class 10 Solutions for ICSE Maths Chapter 21 Measures of Central Tendency Ex 21.1
More Exercises
- ML Aggarwal Class 10 Solutions for ICSE Maths Chapter 21 Measures of Central Tendency Ex 21.1
- ML Aggarwal Class 10 Solutions for ICSE Maths Chapter 21 Measures of Central Tendency Ex 21.2
- ML Aggarwal Class 10 Solutions for ICSE Maths Chapter 21 Measures of Central Tendency Ex 21.3
- ML Aggarwal Class 10 Solutions for ICSE Maths Chapter 21 Measures of Central Tendency Ex 21.4
- ML Aggarwal Class 10 Solutions for ICSE Maths Chapter 21 Measures of Central Tendency Ex 21.5
- ML Aggarwal Class 10 Solutions for ICSE Maths Chapter 21 Measures of Central Tendency Ex 21.6
- ML Aggarwal Class 10 Solutions for ICSE Maths Chapter 21 Measures of Central Tendency MCQS
- ML Aggarwal Class 10 Solutions for ICSE Maths Chapter 21 Measures of Central Tendency Chapter Test
Question 1.
(a) Calculate the arithmetic mean of 5.7, 6.6, 7.2, 9.3, 6.2.
(b) The weights (in kg) of 8 new born babies are 3, 3.2, 3.4, 3.5, 4, 3.6, 4.1, 3.2. Find the mean weight of the babies.
Solution:
(a) Sum of 5 observations = 5.7 + 6.6 + 7.2 + 9.3 + 6.2 = 35.0
∴ Mean = \(\\ \frac { 35.0 }{ 5 } \) = 7
(b) Weights of 8 babies (in kg) are 3, 3.2, 3.4, 3.5, 4, 3.6, 4.1, 3.2
∴ Total weights of 8 babies
= 3 + 3.2 + 3.4 + 3.5 + 4 + 3.6 + 4.1 + 3.2 = 28.0 kg
Mean weight = \(\frac { \sum { { x }_{ i } } }{ n } \)
= \(\\ \frac { 28.0 }{ 8 } \) (Here n = 8)
= 3.5 kg
Question 2.
The marks obtained by 15 students in a class test are 12, 14, 07, 09, 23, 11, 08, 13, 11, 19, 16, 24, 17, 03, 20 find
(i) the mean of their marks.
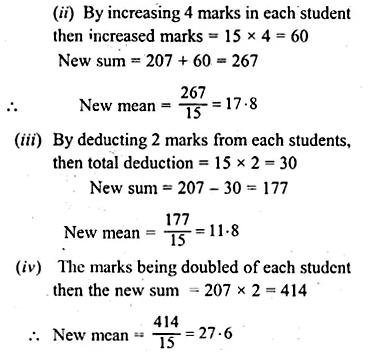
(ii) the mean of their marks when the marks of each student are increased by 4.
(iii) the mean of their marks when 2 marks are deducted from the marks of each student.
(iv) the mean of their marks when the marks of each student are doubled.
Solution:
Sum of marks of 15 students.
= 12 + 14 + 07 + 09 + 23 + 11 + 08 + 13 + 11 + 19 + 16 + 24 + 17 + 03 + 20
= 207
(i) Mean = \(\\ \frac { 207 }{ 15 } \)
= 13.8
Question 3.
(a) The mean of the numbers 6, y, 7, x, 14 is 8. Express y in terms of x.
(b) The mean of 9 variates is 11. If eight of them are 7, 12, 9, 14, 21, 3, 8 and 15 find the 9th variate.
Solution:
(a) Sum of numbers = 6 + y + 7 + x + 14
= 27 + x + y …(i)
But mean of 5 numbers = 8
∴ Sum = 8 × 5 = 40 …(ii)
From (i) and (ii)
27 + x + y = 40
⇒ x + y = 40 – 27 = 13
∴ y = 13 – x
(b) Mean of 9 variates = 11
∴ Total sum =11 × 9 = 99
But sum of 8 of these variates
= 7 + 12 + 9 + 14 + 21 + 3 + 8 + 15 = 89
∴ 9th variate = 99 – 89 = 10
Question 4.
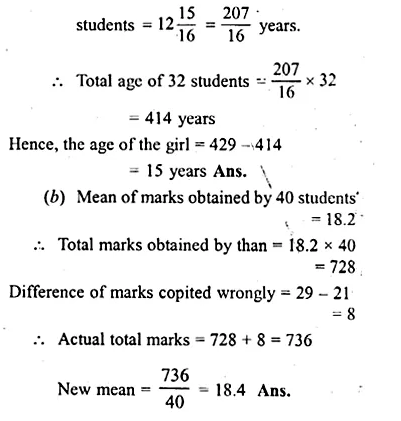
(a) The mean age of 33 students of a class is 13 years. If one girl leaves the class, the mean becomes \(12 \frac { 15 }{ 16 } \) years. What is the age of the girl ?
(b) In a class test, the mean of marks scored by a class of 40 students was calculated as 18.2. Later on, it was detected that marks of one student was wrongly copied as 21 instead of 29. Find the correct mean.
Solution:
(a) Mean age of 33 students = 13 years
Total age = 13 × 33 = 429 years
After leaving one girl, the mean of 32
Question 5.
Find the mean of 25 given numbers when the mean of 10 of them is 13 and the mean of the remaining numbers is 18.
Solution:
Mean of 10 numbers = 13
Sum = 13 × 10 = 130
and mean of remaining 15 numbers = 18
Sum = 18 × 15 = 270
Total sum of 25 numbers = 130 + 270 = 400
Mean of 25 numbers = \(\\ \frac { 400 }{ 25 } \) = 16
Question 6.
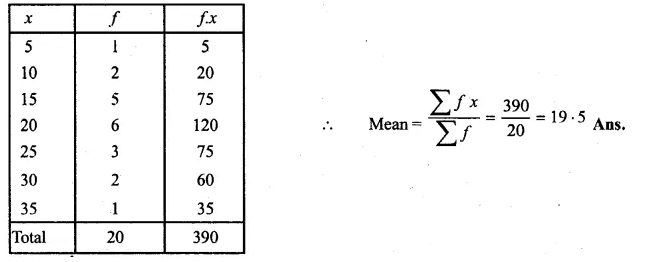
Find the mean of the following distribution:

Solution:
Question 7.
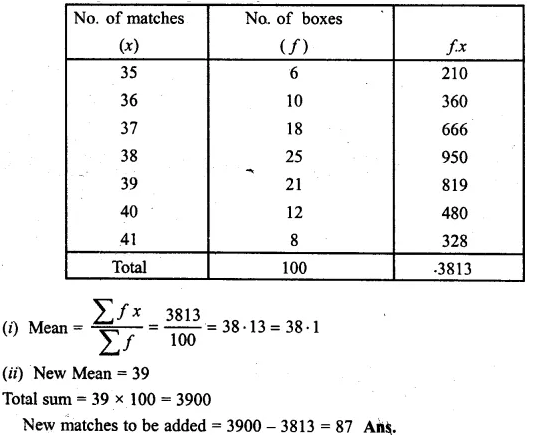
The contents of 100 match boxes were checked to determine the number of matches they contained

(i) Calculate, correct to one decimal place, the mean number of matches per box.
(ii) Determine how many extra matches would have to be added to the total contents of the 100 boxes to; bring the mean upto exactly 39 matches. (1997)
Solution:
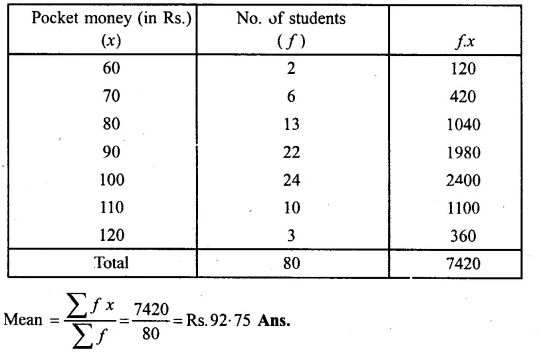
Question 8.
Calculate the mean for the following distribution :
 >
>
Solution:
Question 9.
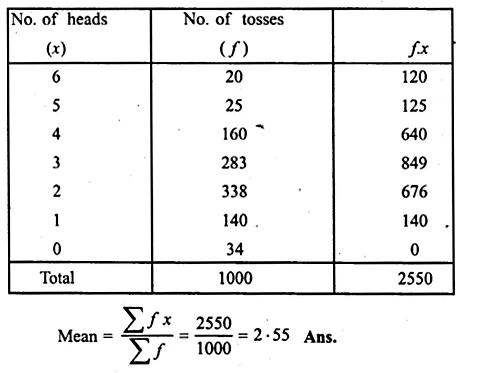
Six coins were tossed 1000 times, and at each toss the number of heads were counted and the results were recorded as under :

Calculate the mean for this distribution.
Solution:
Question 10.
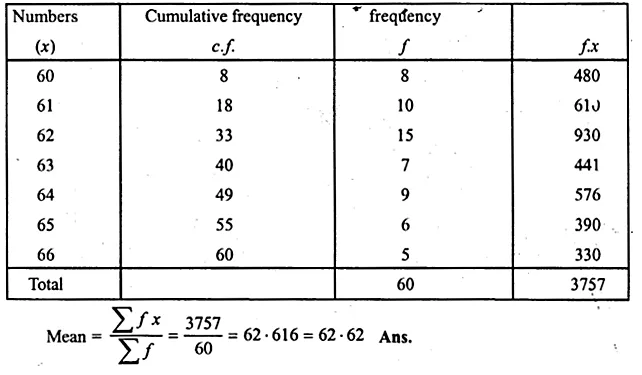
Find the mean for the following distribution

Solution:
Question 11.

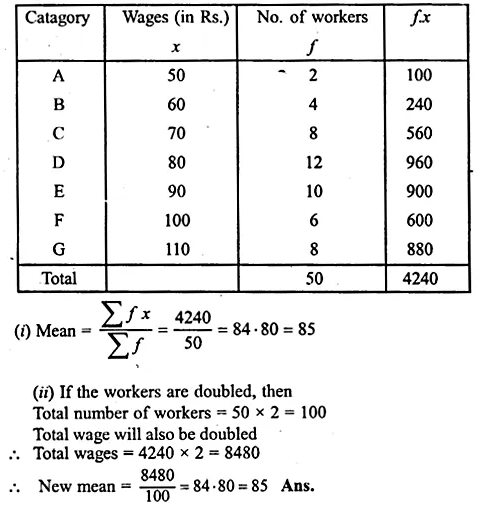
(i) Calculate the mean wage correct to the nearest rupee (1995)
(ii) If the number of workers in each category is doubled, what would be the new mean wage ?
Solution:
Question 12.
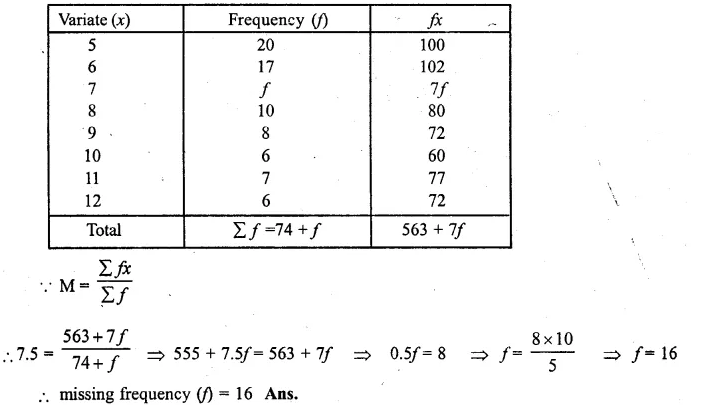
If the mean of the following distribution is 7.5, find the missing frequency ” f “.

Solution:
Question 13.
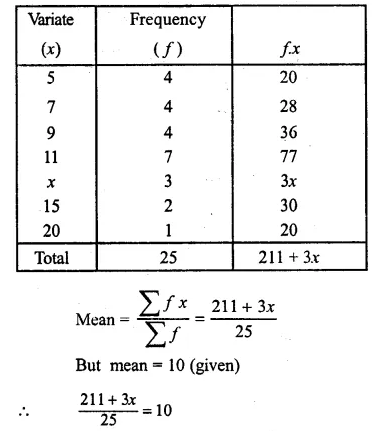
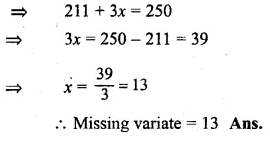
Find the value of the missing variate for the following distribution whose mean is 10

Solution:
Let missing variate be x, then
Question 14.
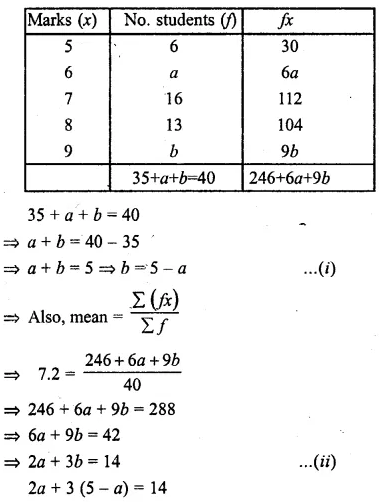
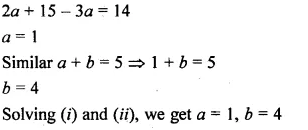
Marks obtained by 40 students in a short assessment are given below, where a and b are two missing data.

If the mean of the distribution is 7.2, find a and b.
Solution:
Question 15.
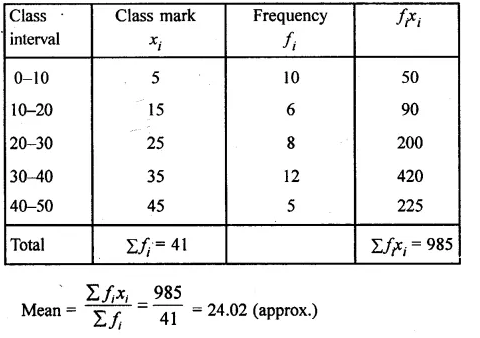
Find the mean of the following distribution

Solution:
Question 16.
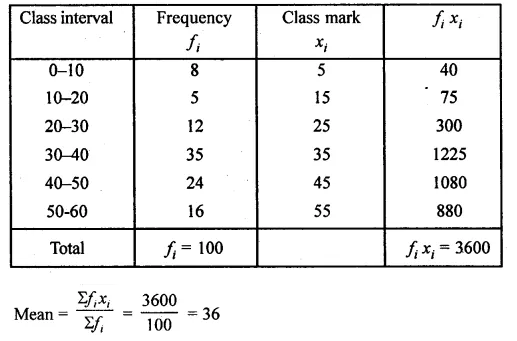
Calculate the mean of the following distribution:

Solution:
Consider the following distribution :
Question 17.
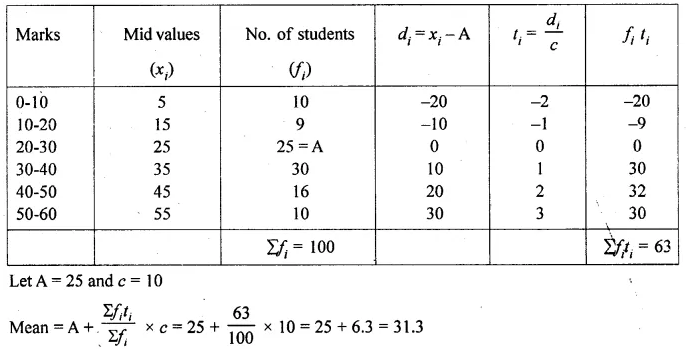
Calculate the mean of the following distribution using step deviation method:

Solution:
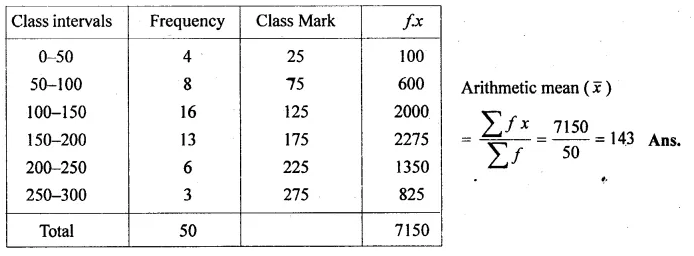
Question 18.
Find the mean of the following frequency distribution:

Solution:
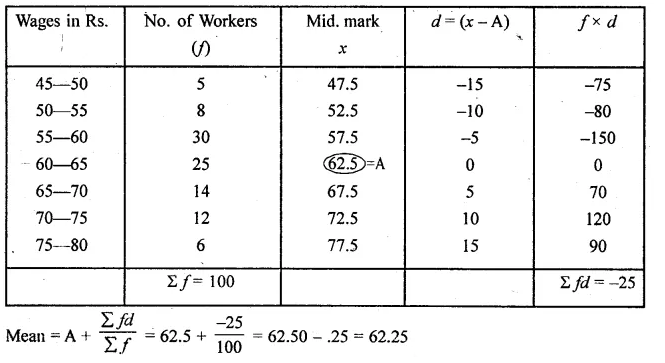
Question 19.
The following table gives the daily wages of workers in a factory:

Calculate their mean by short cut method.
Solution:
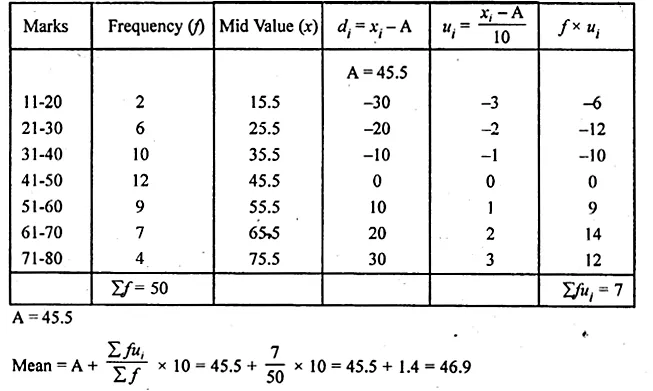
Question 20.
Calculate the mean of the distribution given below using the short cut method.

Solution:
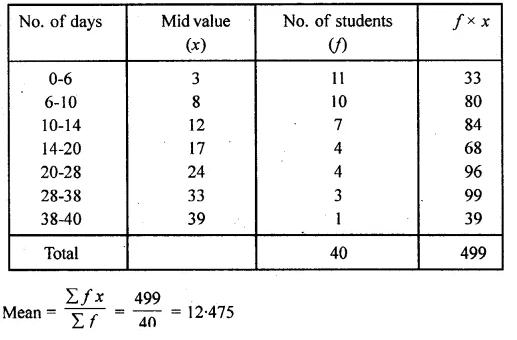
Question 21.
A class teacher has the following absentee record of 40 students of a class for the whole term. Find the mean number of days a students was absent.

Solution:
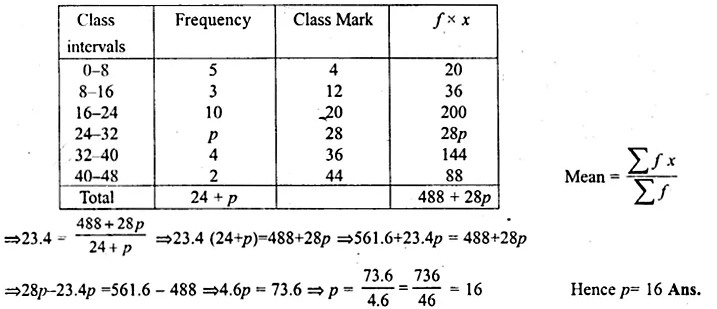
Question 22.
The mean of the following distribution is 23.4. Find the value of p.

Solution:
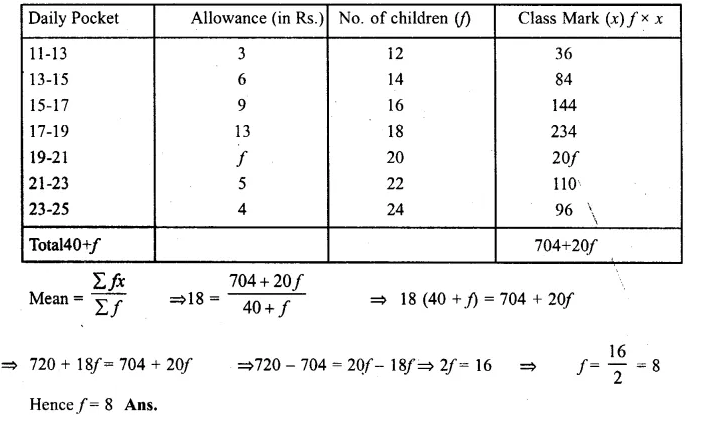
Question 23.
The following distribution shows the daily pocket allowance fo children of a locality. The mean pocket allowance is Rs. 18. Find the value of f

Solution:
Mean = Rs. 18
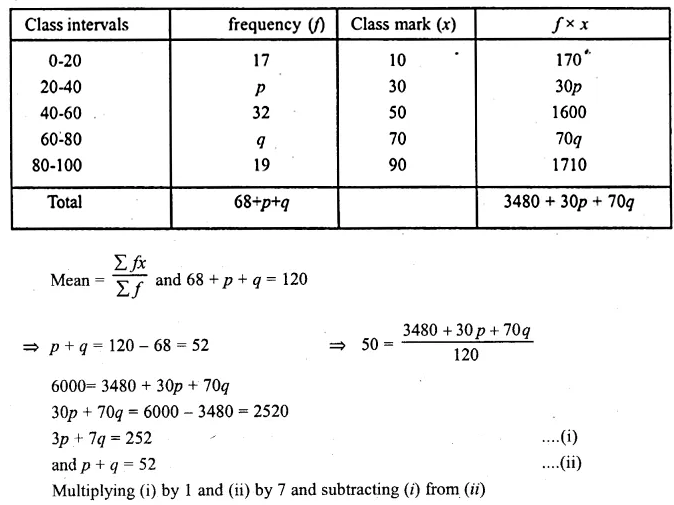
Question 24.
The mean of the following distribution is 50 and the sum of all the frequencies is 120. Find the values of p and q.

Solution:
Mean = 50, Total number of frequency = 120

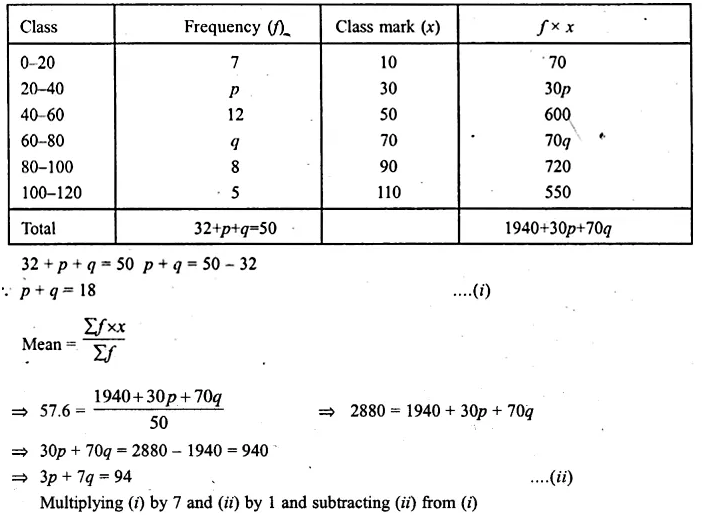
Question 25.
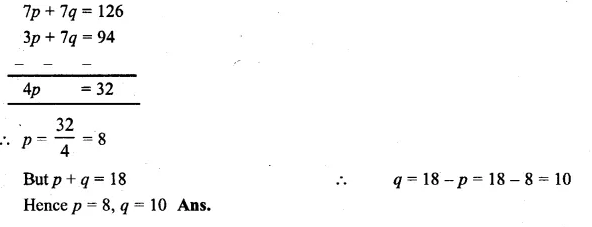
The mean of the following frequency distribution is 57.6 and the sum of all the frequencies is 50. Find the values of p and q.

Solution:
Mean = 57.6
and sum of all frequencies = 50
Question 26.
The following table gives the life time in days of 100 electricity tubes of a certain make :
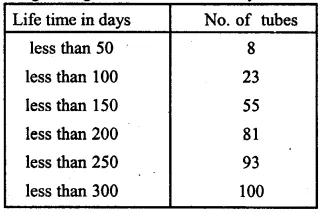
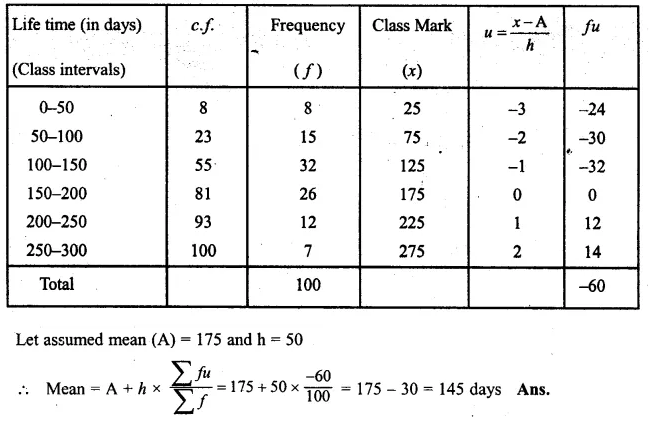
Find the mean life time of electricity tubes.
Solution:
Question 27.
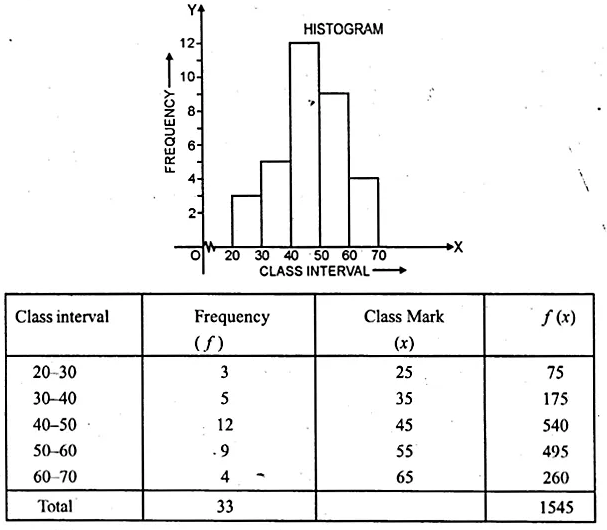
Using the information given in the adjoining histogram, calculate the mean correct to one decimal place.
Solution:
From the histogram given, we represent the information in the following table :

We hope the ML Aggarwal Class 10 Solutions for ICSE Maths Chapter 21 Measures of Central Tendency Ex 21.1 help you. If you have any query regarding ML Aggarwal Class 10 Solutions for ICSE Maths Chapter 21 Measures of Central Tendency Ex 21.1, drop a comment below and we will get back to you at the earliest.