ML Aggarwal Class 10 Solutions for ICSE Maths Chapter 21 Measures of Central Tendency Ex 21.4
These Solutions are part of ML Aggarwal Class 10 Solutions for ICSE Maths. Here we have given ML Aggarwal Class 10 Solutions for ICSE Maths Chapter 21 Measures of Central Tendency Ex 21.4
More Exercises
- ML Aggarwal Class 10 Solutions for ICSE Maths Chapter 21 Measures of Central Tendency Ex 21.1
- ML Aggarwal Class 10 Solutions for ICSE Maths Chapter 21 Measures of Central Tendency Ex 21.2
- ML Aggarwal Class 10 Solutions for ICSE Maths Chapter 21 Measures of Central Tendency Ex 21.3
- ML Aggarwal Class 10 Solutions for ICSE Maths Chapter 21 Measures of Central Tendency Ex 21.4
- ML Aggarwal Class 10 Solutions for ICSE Maths Chapter 21 Measures of Central Tendency Ex 21.5
- ML Aggarwal Class 10 Solutions for ICSE Maths Chapter 21 Measures of Central Tendency Ex 21.6
- ML Aggarwal Class 10 Solutions for ICSE Maths Chapter 21 Measures of Central Tendency MCQS
- ML Aggarwal Class 10 Solutions for ICSE Maths Chapter 21 Measures of Central Tendency Chapter Test
Question 1.
Draw a histogram for the following frequency distribution and find the mode from the graph :

Solution:

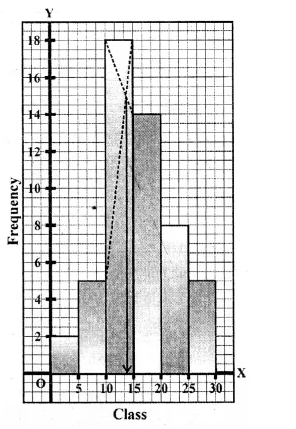
Mode = 14
Question 2.
Find the modal height of the following distribution by drawing a histogram :

Solution:
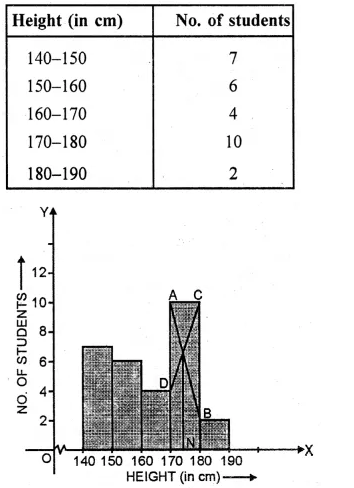
Now present the Height on x-axis and No. of students (frequency) on the y-axis
and draw a histogram as shown. In the histogram join AB and CD intersecting at M.
From M, draw MN to the x-axis. N shows the mode.
Hence mode = 174 cm
Question 3.
A Mathematics aptitude test of 50 students was recorded as follows :

Draw a histogram for the above data using a graph paper and locate the mode. (2011)
Solution:
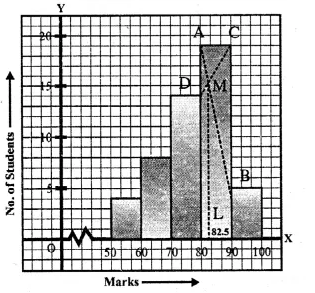
Hence, the required mode is 82.5.
Question 4.
Draw a histogram and estimate the mode for the following frequency distribution :

Solution:
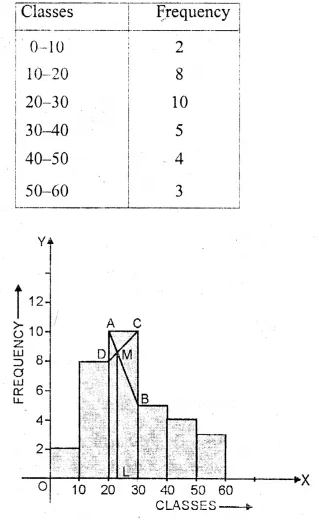
Representing classes on x-axis and frequency on the y-axis,
we draw a histogram as shown.
In the histogram, join AB and CD intersecting at M.
From M, draw ML perpendicular to the x-axis. L shows the mode
Hence Mode = 23
Question 5.
IQ of 50 students was recorded as follows

Draw a histogram for the above data and estimate the mode.
Solution:
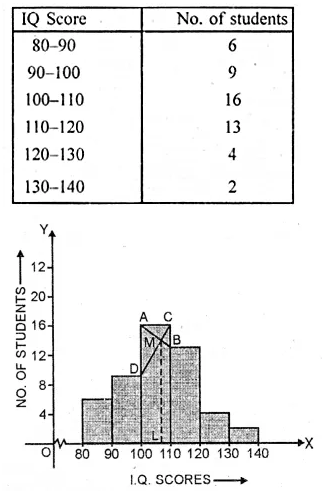
Representing the IQ scores on x-axis and number of students on the y-axis,
we draw a histogram as shown. Join AB and CD intersecting each other at M.
From M draw ML ⊥ x-axis. L is the mode which is 107
Question 6.
Use a graph paper for this question. The daily pocket expenses of 200 students in a school are given below:
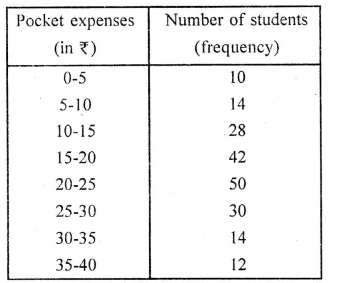
Draw a histogram representing the above distribution and estimate the mode from the graph.
Solution:
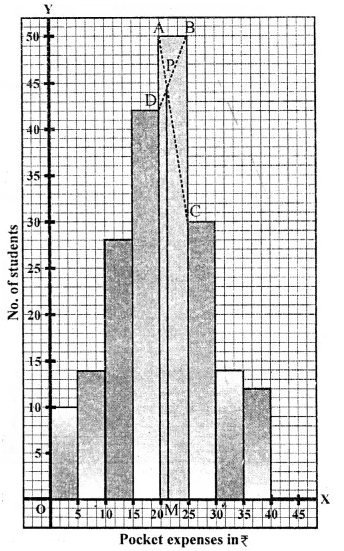
Mark the upper comers of the highest rectangle
and the corners of the adjacent rectangles as A, B, C, D as shown.
Join AC and BD to intersect at P. Draw PM ⊥ x-axis.
Then the abscissa of M is 21, which is the required mode.
Hence, mode = 21
Question 7.
Draw a histogram for the following distribution :

Hence estimate the modal weight.
Solution:
We write the given distribution in the continuous form :
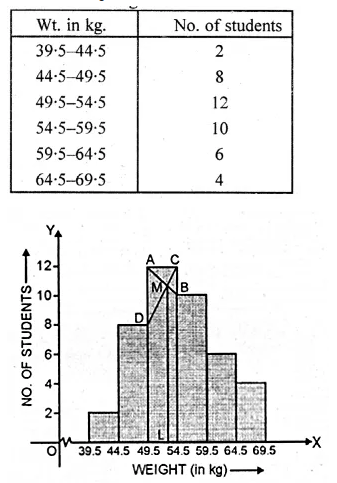
Representing the weight (in kg) on x-axis
and No. of students on y-axis. We draw a histogram as shown.
Now join AB and CD intersecting each other at M.
From M, draw ML perpendicular to x-axis.
L is the mode which is 51.5 kg
Question 8.
Find the mode of the following distribution by drawing a histogram

Also state the modal class.
Solution:
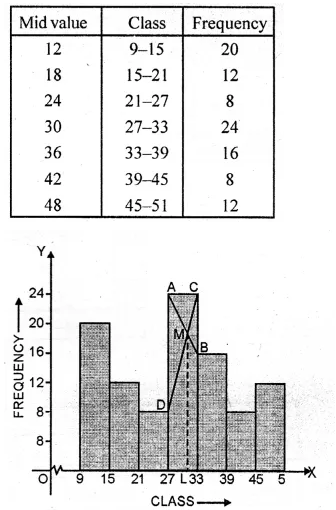
Representing class on x-axis and frequency on the y-axis,
we draw a histogram as shown.
Join AB and CD intersecting each other at M.
From M, draw ML perpendicular to the x-axis.
L shows the mode which is 30.5 and class is 27-33.
We hope the ML Aggarwal Class 10 Solutions for ICSE Maths Chapter 21 Measures of Central Tendency Ex 21.4 help you. If you have any query regarding ML Aggarwal Class 10 Solutions for ICSE Maths Chapter 21 Measures of Central Tendency Ex 21.4, drop a comment below and we will get back to you at the earliest.