NCERT Solutions for Class 7 Maths Chapter 3 Data Handling Ex 3.3 are part of NCERT Solutions for Class 7 Maths. Here we have given NCERT Solutions for Class 7 Maths Chapter 3 Data Handling Ex 3.3.
- Data Handling Class 7 Ex 3.1
- Data Handling Class 7 Ex 3.2
- Data Handling Class 7 Ex 3.4
- Data Handling Class 7 MCQ
| Board | CBSE |
| Textbook | NCERT |
| Class | Class 7 |
| Subject | Maths |
| Chapter | Chapter 3 |
| Chapter Name | Data Handling |
| Exercise | Ex 3.3 |
| Number of Questions Solved | 6 |
| Category | NCERT Solutions |
NCERT Solutions for Class 7 Maths Chapter 3 Data Handling Ex 3.3
Question 1.
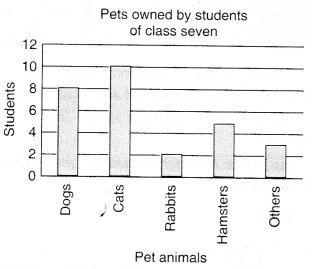
Use the bar graph to answer the following questions.
(a) Which is the most popular pet?
(b) How many children have dog as a pet?
Solution:
(a) The most popular pet is ‘Cat’.
(b) 8 children have a dog as a pet.
Question 2.
Read the bar graph which shows the number of books sold by a bookstore during five consecutive years and answer the following questions:
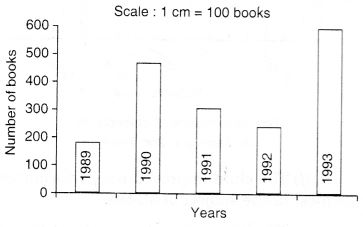
- About how many books were sold in 1989?1990?1992?
- ln which year were about 475 books sold? About 225 books sold?
- In which years were fewer than 250 books sold?
- Can you explain how you would estimate the number of books sold in 1989?
Solution:
Clearly, from the given graph, we have
- Number of books sold in the year
1989: 170 (approx.)
1990: 475 (approx.)
1992: 225 (approx.) - In the year 1990, about 475 books were sold. In the year 1992, about 225 books were sold.
- Fewer than 250 books were sold in the years 1989 and 1992.
- It can be estimated using the height of the bar such that the height of 1 cm = 100 books.
Question 3.
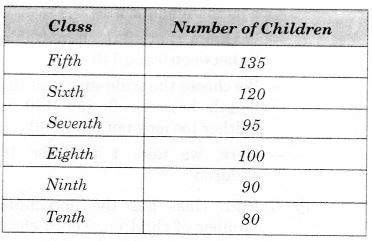
The number of children in six different classes is given below. Represent the data on a bar graph.
(a) How would you choose a scale?
(b) Answer the following questions:
(i) Which class has the maximum number of children? And the minimum?
(ii) Find the ratio of students of class sixth to the students of the class eighth.
Solution:
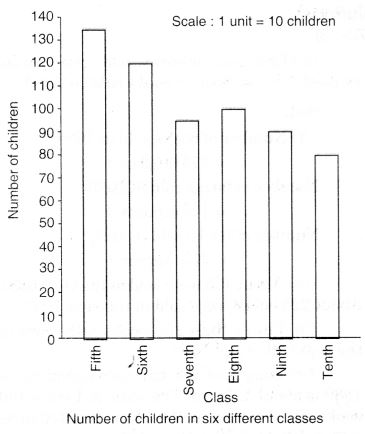
(a) Start the scale at 0. The greatest value in the data is 135, so end the scale at a value greater than 135, such as 140. Use equal divisions along the axes, such as increments of 10.
We know that all the bars would lie between 0 and 140.
We choose the scale such that the length between 0 and 140 is neither too long nor too small.
Here, we take 1 unit for 10 children.
(b) (i) Fifth class has the maximum number of children. Tenth class has the minimum number of children.
(ii) Ratio of students of class sixth to eighth = 120 : 100 = \(\frac { 12 }{ 100 } \) = \(\frac { 6 }{ 5 } \) = 6 : 5
Question 4.
The performance of a student in 1st Term and, 2nd Term is given. Draw a double bar graph choosing the appropriate scale and answer the following :
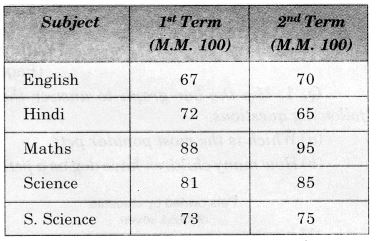
- In which subject, has the child improved his performance the most?
- In which subject is the improvement the least?
- Has the performance gone down in any subject?
Solution:
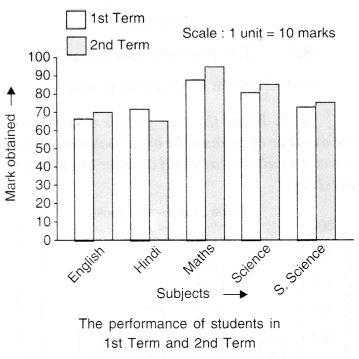
- The child improved his performance the most in the subject of Maths.
- The improvement is the least in the subject of S. Science.
- Yes! The performance has gone down in the subject of Hindi.
Question 5.
Consider this data collected from a survey of a colony.
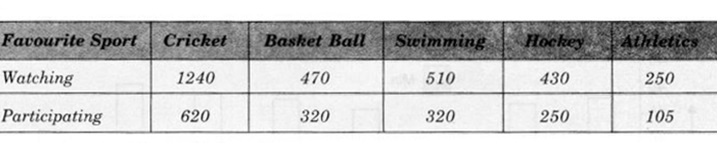
- Draw a double graph choosing an appropriate scale.
What do you infer from the bar graph? - Which sport is most popular?
- Which is more preferred, watching or participating in sports?
Solution:
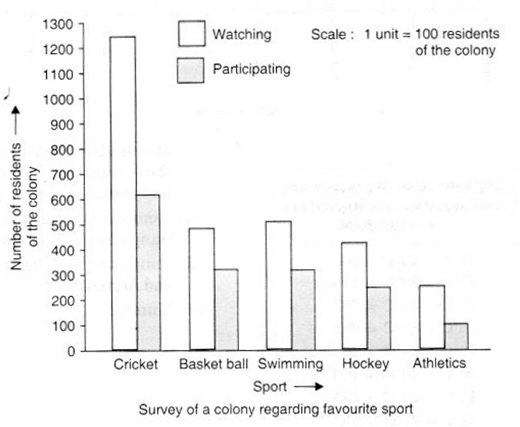
- It is inferred that more people prefer cricket and fewer athletics.
- The most popular sport is cricket.
- Watching is more preferred than participating.
Question 6.
Take the data giving the minimum and the maximum temperature of various cities given at the beginning of this chapter. Plot a double bar graph using the data and answer the following:
- Which city has the largest difference in the minimum and maximum temperature on the given date?
- Which is the hottest city and which is the coldest city?
- Name two cities where the maximum temperature of one was less than the minimum temperature of the other.
- Name the city which has the least difference between its minimum and the maximum temperature.
Solution:
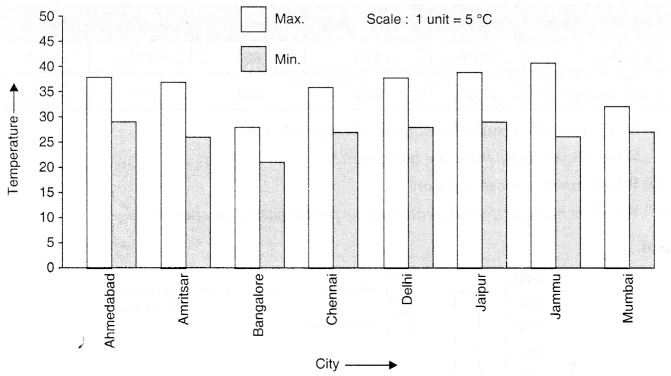
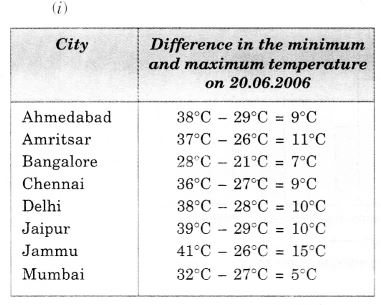
- The city Jammu has the largest difference in the minimum and maximum temperature on the given date.
- Jammu is the hottest city and Bangalore is the coldest city.
- The name of the two cities where the maximum temperature of one was less than the minimum temperature of the other is Bangalore and Jaipur or Bangalore and Ahmedabad.
- Mumbai has the least difference between its minimum and maximum temperature.
We hope the NCERT Solutions for Class 7 Maths Chapter 3 Data Handling Ex 3.3 help you. If you have any query regarding NCERT Solutions for Class 7 Maths Chapter 3 Data Handling Ex 3.3, drop a comment below and we will get back to you at the earliest.