RD Sharma Class 10 Solutions Chapter 15 Statistics Ex 15.6
These Solutions are part of RD Sharma Class 10 Solutions. Here we have given RD Sharma Class 10 Solutions Chapter 15 Statistics Ex 15.6
Other Exercises
- RD Sharma Class 10 Solutions Chapter 15 Statistics Ex 15.1
- RD Sharma Class 10 Solutions Chapter 15 Statistics Ex 15.2
- RD Sharma Class 10 Solutions Chapter 15 Statistics Ex 15.3
- RD Sharma Class 10 Solutions Chapter 15 Statistics Ex 15.4
- RD Sharma Class 10 Solutions Chapter 15 Statistics Ex 15.5
- RD Sharma Class 10 Solutions Chapter 15 Statistics Ex 15.6
- RD Sharma Class 10 Solutions Chapter 15 Statistics Ex VSAQS
- RD Sharma Class 10 Solutions Chapter 15 Statistics MCQS
Question 1.
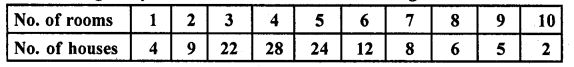
Draw an ogive by less than method for the following data :
Solution:
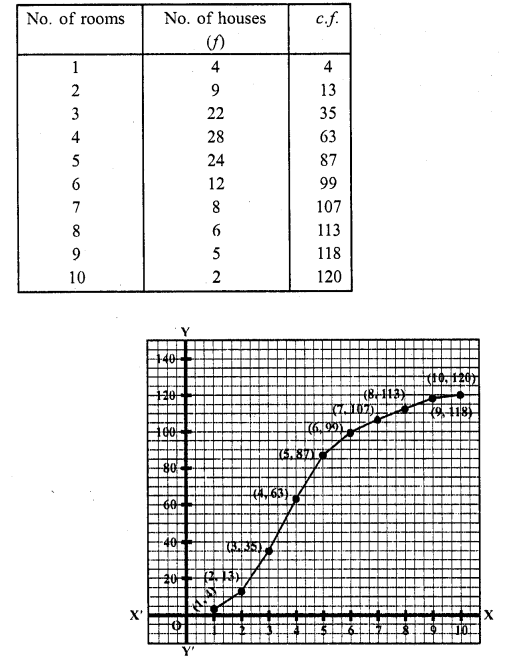
Take numbers of rooms along the x-axis and c.f along the y-axis
Plot the points (1, 4), (2, 13), (3, 35), (4, 63), (5, 87), (6, 99), (7, 107), (8, 113), (9, 118) and (10, 120) on the graph and join them and with free hand to get an ogive as shown. This is the less than ogive.
Question 2.
The marks scored by 750 students in an examination are given in the form of a frequency distribution table:
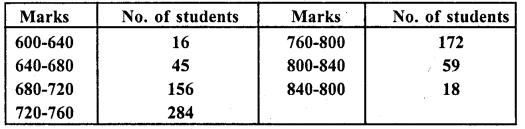
Prepare a cumulative frequency table by less than method and draw on ogive.
Solution:
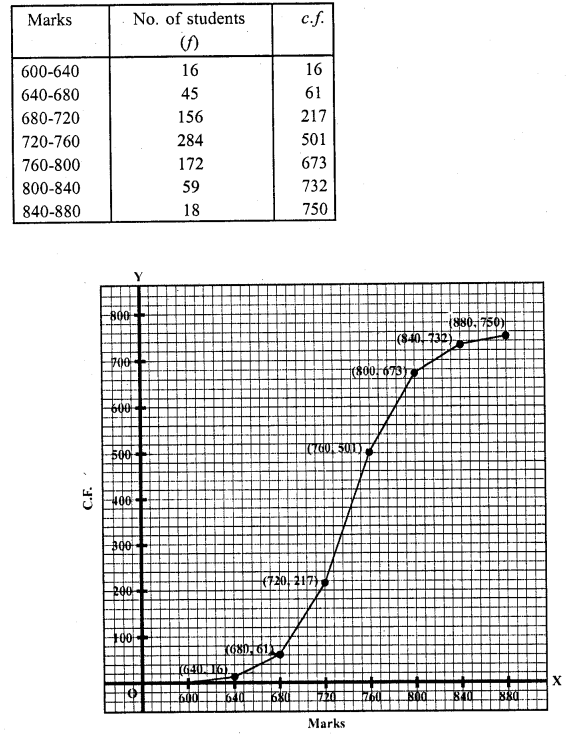
Take marks along ,t-axis and no. of students (c.f) along 3 -axis. Now plot the points (640, 16), (680, 61), (720, 217), (760, 501), (800, 673), (840, 732) and (880, 750) on the graph and join them with free hand. This is the less than ogive.
Question 3.
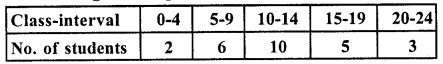
Draw an ogive to represent the following frequency distribution:
Solution:
Representing the classes in exclusive form :
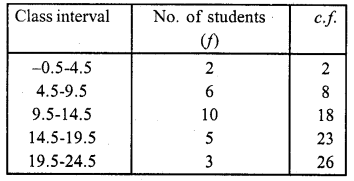
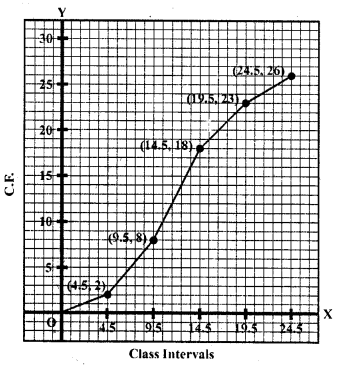
Represent class intervals along x-axis and c.f. along y-axis. Now plot the points (4.5, 2), (9.5, 8), (14.5, 18), (19.5, 23) and (24.5, 26) on the graph and join then in free hand to get an ogive as shown.
Question 4.
The monthly profits (in Rs.) of 100 shops are distributed as follows:
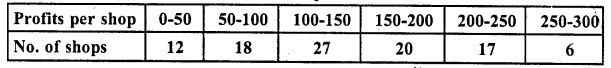
Draw the frequency polygon for it.
Solution:
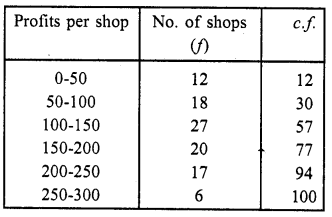
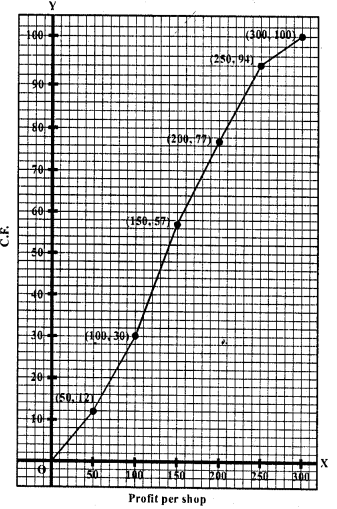
Represent profits per shop along x-axis and no. of shop (c.f.) along y-axis.
Plot the points (50, 12), (100, 30), (150, 57), (200, 77), (250, 94) and (300, 100) on the graph and join them with ruler. This is the cumulative polygon as shown.
Question 5.
The following distribution gives the daily income of 50 workers of a factory:
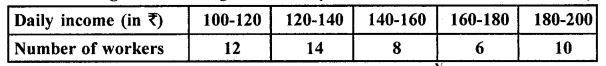
Convert the above distribution to a less than type cumulative frequency distribution and draw its ogive.
Solution:
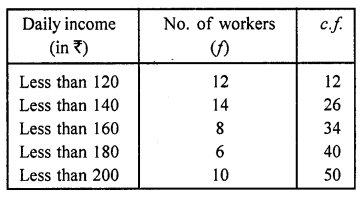
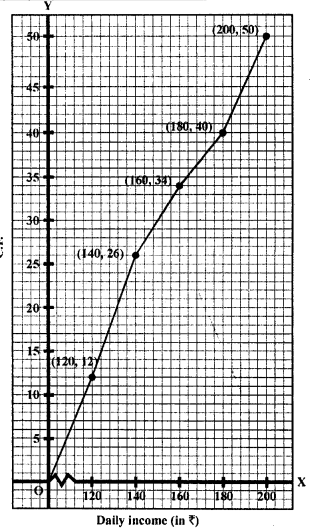
Now plot the points (120, 12), (140, 26), (160, 34), (180, 40) and (200,50) on the graph and join them with free hand to get an ogive which is less than.
Question 6.
The following table gives production yield per hectare of wheat of 100 farms of a village:

Draw ‘less than’ ogive and ‘more than’ ogive.
Solution:
(i) Less than
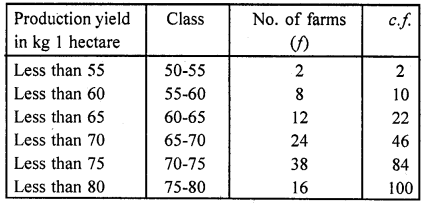
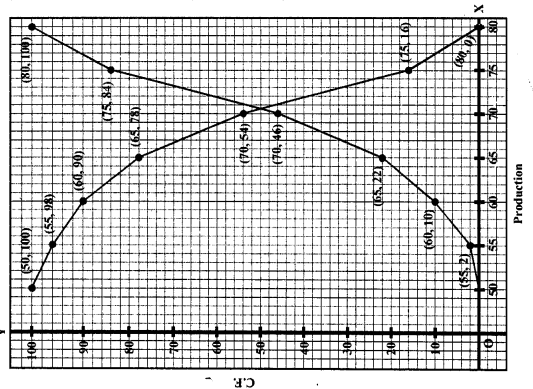
Now plot the points (55, 2), (60, 10), (65, 22), (70, 46), (75, 84) and (80, 100) on the graph and join them in free hand to get a less than ogive.
(ii) More than
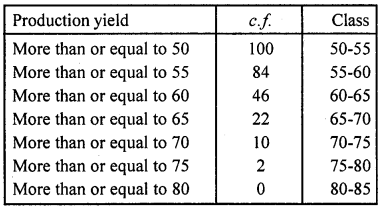
Now plot the points (50, 100), (55, 84), (60, 46), (65, 22), (70, 10), (75, 2) and (80, 0) on the graph and join than in free hand to get a more than ogive as shown below :
Question 7.
During the medical check-up of 35 students of a class, their weights were recorded as follows :
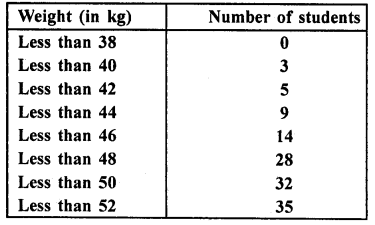
Draw a less than type ogive for the given data. Hence, obtain the median weight from the graph and verify the result by using the formula. (C.B.S.E. 2009)
Solution:
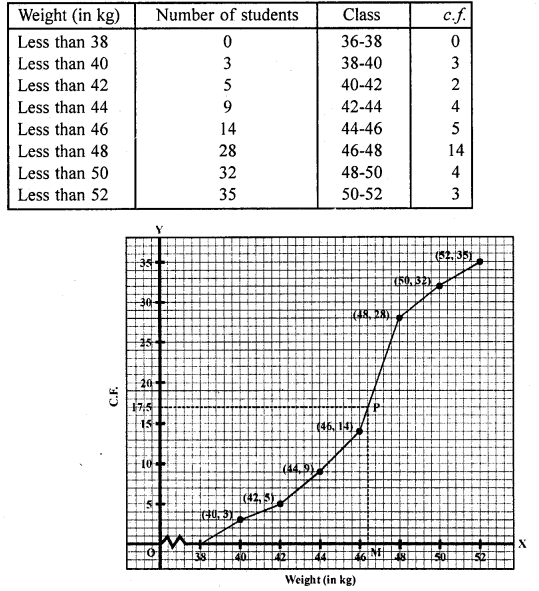
Plot the points (38, 0), (40, 3), (42, 5), (44, 9), (46, 14), (48, 28), (50, 32), (52, 35) on the graph and join them in free hand to get an ogive as shown.
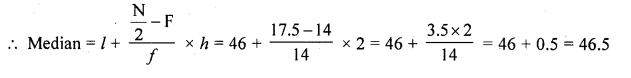
Here N = 35 which is odd
∴ \(\frac { N }{ 2 }\) = \(\frac { 25 }{ 2 }\) = 17.5
From 17.5 on y-axis draw a line parallel to x-axis meeting the curve at P. From P, draw PM ⊥ x-axis
∴ Median which is 46.5 (approx)
Now N = 17.5 lies in the class 46 – 48 (as 14 < 17.5 < 28)
∴ 46-48 is the median class
Here l= 46, h = 2,f= 14, F= 14
Question 8.
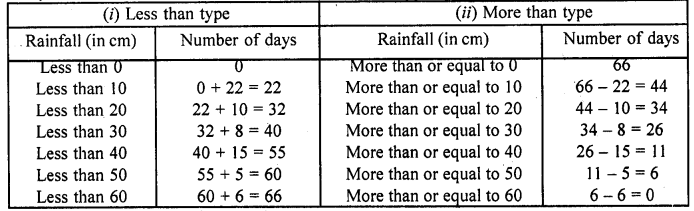
The annual rainfall record of a city for 66 days is given in the following tab

Calculate the median rainfall using ogives of more than type and less than type. [NCERT Exemplar]
Solution:
We observe that, the annual rainfall record of a city less than 0 is 0. Similarly, less than 10 include the annual rainfall record of a city from 0 as well as the annual rainfall record of a city from 0-10. So, the total annual rainfall record of a city for less than 10 cm is 0 + 22 = 22 days. Continuing in this manner, we will get remaining less than 20, 30, 40, 50 and 60.
Also, we observe that annual rainfall record of a city for 66 days is more than or equal to 0 cm. Since, 22 days lies in the interval 0-10. So, annual rainfall record for 66 – 22 = 44 days is more than or equal to 10 cm. Continuing in this manner we will get remaining more than or equal to 20, 30 , 40, 50, and 60.
Now, we construct a table for less than and more than type.
To draw less than type ogive we plot the points (0,0), (10,22), (20,32), (30, 40), (40, 55), (50, 60), (60, 66) on the paper and join them by free hand.
To draw the more than type ogive we plot the points (0, 66), (10, 44), (20, 34), (30, 26), (40, 11), (50, 6) and (60, 0) on the graph paper and join them by free hand.
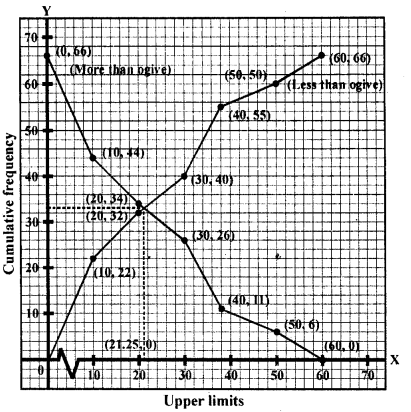
∵ Total number of days (n) = 66
Now, \(\frac { n }{ 2 }\) = 33
Firstly, we plot a line parallel to X-axis at intersection point of both ogives, which further intersect at (0, 33) on Y- axis. Now, we draw a line perpendicular to X-axis at intersection point of both ogives, which further intersect at (21.25, 0) on X-axis. Which is the required median using ogives.
Hence, median rainfall = 21.25 cm.
Question 9.
The following table gives the height of trees:
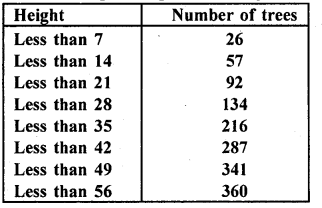
Draw ‘less than’ ogive and ‘more than’ ogive.
Solution:
(i) First we prepare less than frequency table as given below:
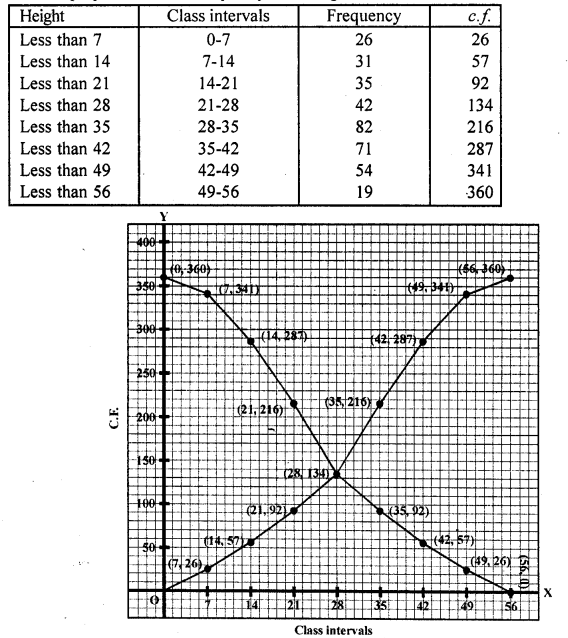
Now we plot the points (7, 26), (14, 57), (21, 92), (28, 134), (35, 216), (42, 287), (49, 341), (56, 360) on the graph and join then in a frequency curve which is ‘less than ogive’
(ii) More than ogive:
First we prepare ‘more than’ frequency table as shown given below:
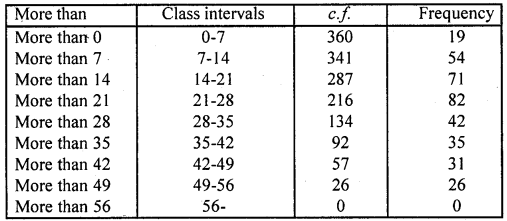
Now we plot the points (0, 360), (7, 341), (14, 287), (21, 216), (28, 134), (35, 92), (42, 57), (49, 26), (56, 0) on the graph and join them in free hand curve to get more than ogive.
Question 10.
The annual profits earned by 30 shops of a shopping complex in a locality give rise to the following distribution:
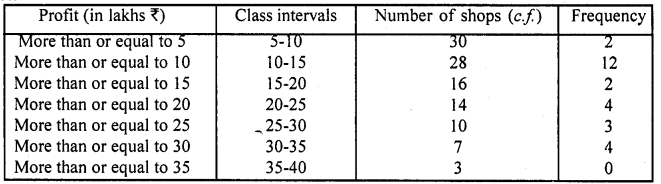
Draw both ogives for the above data and hence obtain the median.
Solution:
Now plot the points (5, 30), (10, 28), (15, 16), (20, 14), (25, 10), (30, 7) and (35, 3) on the graph and join them to get a more than curve.
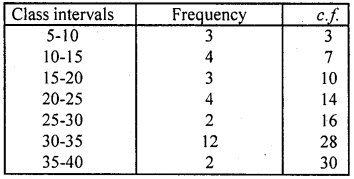
Less than curve:
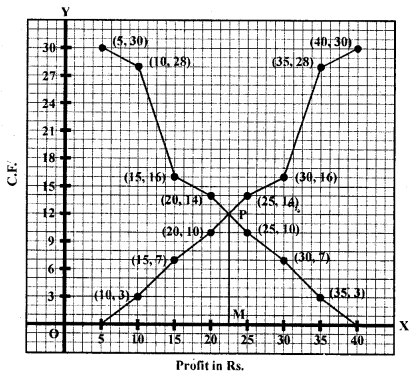
Now plot the points (10, 3), (15, 7), (20, 10), (25, 14), (30, 16), (35, 28) and (40, 30) on the graph and join them to get a less them ogive. The two curved intersect at P. From P, draw PM 1 x-axis, M is the median which is 22.5
∴ Median = Rs. 22.5 lakh
Hope given RD Sharma Class 10 Solutions Chapter 15 Statistics Ex 15.6 are helpful to complete your math homework.
If you have any doubts, please comment below. Learn Insta try to provide online math tutoring for you.