RS Aggarwal Solutions Class 10 Chapter 9 Mean, Median, Mode of Grouped Data,Cumulative Frequency Graph and O give Ex 9e
These Solutions are part of RS Aggarwal Solutions Class 10. Here we have given RS Aggarwal Solutions Class 10 Chapter 9 Mean, Median, Mode of Grouped Data,Cumulative Frequency Graph and O give Ex 9e.
Other Exercises
- RS Aggarwal Solutions Class 10 Chapter 9 Mean, Median, Mode of Grouped Data Ex 9a
- RS Aggarwal Solutions Class 10 Chapter 9 Mean, Median, Mode of Grouped Data Ex 9b
- RS Aggarwal Solutions Class 10 Chapter 9 Mean, Median, Mode of Grouped Data Ex 9c
- RS Aggarwal Solutions Class 10 Chapter 9 Mean, Median, Mode of Grouped Data Ex 9d
- RS Aggarwal Solutions Class 10 Chapter 9 Mean, Median, Mode of Grouped Data Ex 9e
- RS Aggarwal Solutions Class 10 Chapter 9 Mean, Median, Mode of Grouped Data Ex 9f
- RS Aggarwal Solutions Class 10 Chapter 9 Mean, Median, Mode of Grouped Data MCQ
- RS Aggarwal Solutions Class 10 Chapter 9 Mean, Median, Mode of Grouped Data Test Yourself
Question 1.
Solution:

We plot the points (10, 5), (20, 8), (30, 12), (40, 15), (50, 18), (60, 22), (70, 29), (80, 38), (90, 45) and (100, 53) to get the ‘less than type’ ogive as follows:
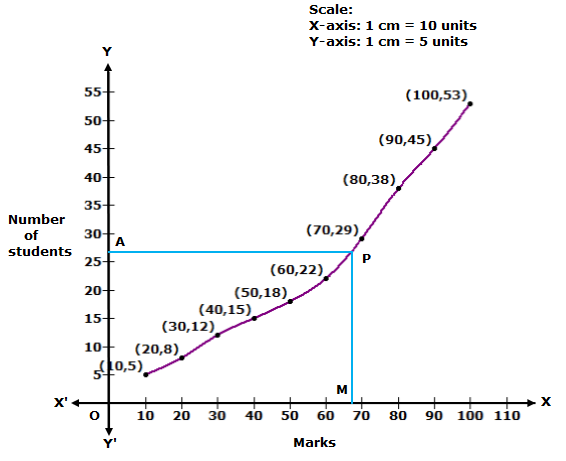
Here, N = 53 ⇒ N/2 = 26.5.
At y = 26.5, affix A.
Through A, draw a horizontal line meeting the curve at P.
Through P, a vertical line is drawn which meets OX at M.
OM = 68 units
Hence, median marks = 68
Question 2.
Solution:
We plot the points (15, 2), (30, 5), (45, 9), (60, 17), (75, 39), (90, 54), (105, 70) and (120, 80) to get the ‘less than type’ ogive as follows:
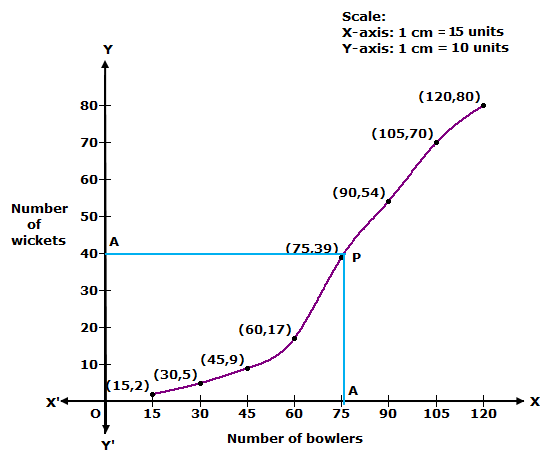
Here, N = 80 ⇒ N/2 = 40.
At y = 40, affix A.
Through A, draw a horizontal line meeting the curve at P.
Through P, a vertical line is drawn which meets OX at M.
OM = 78 units
Hence, median number of wickets = 78
Question 3.
Solution:

We plot the points (0, 100), (10, 96), (20, 90), (30, 80), (40, 70), (50, 45), (60, 23) and (70, 5) to get the ‘more than type’ ogive as follows:
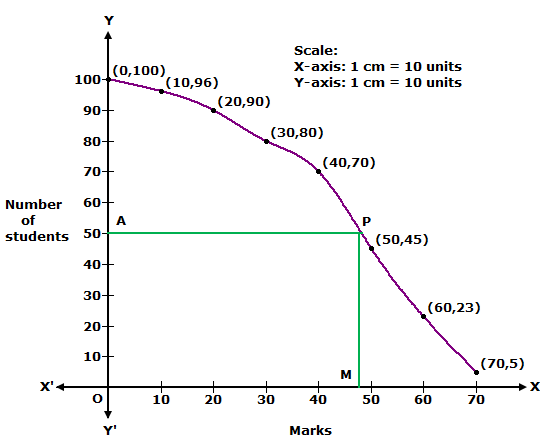
Here, N = 100 ⇒ N/2 = 50.
At y = 50, affix A.
Through A, draw a horizontal line meeting the curve at P.
Through P, a vertical line is drawn which meets OX at M.
OM = 47 units
Hence, median marks = 47.
Question 4.
Solution:

We plot the points (135, 50), (140, 45), (145, 37), (150, 28), (155, 16) and (160, 2) to get the ‘more than type’ ogive as follows:
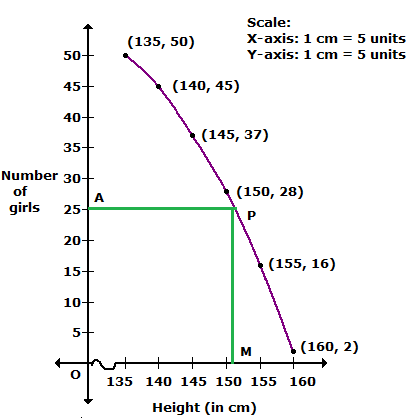
Here, N = 50 ⇒ N/2 = 25.
At y = 25, affix A.
Through A, draw a horizontal line meeting the curve at P.
Through P, a vertical line is drawn which meets OX at M.
OM = 151 units
Hence, median height = 151 cm.
Question 5.
Solution:

We plot the points (140, 156), (160, 153), (180, 145), (200, 130), (220, 90), (240, 40) and (260, 10) to get the ‘more than type’ ogive as follows:
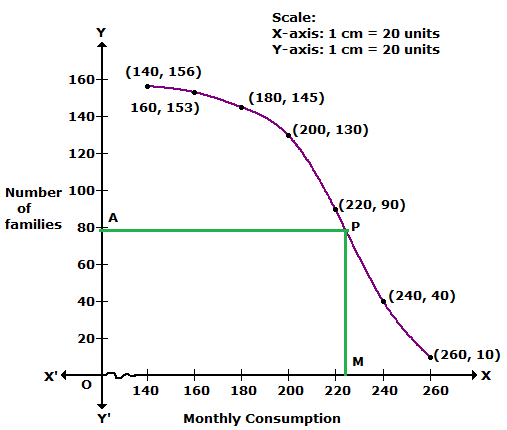
Here, N = 156 ⇒ N/2 = 78.
At y = 78, affix A.
Through A, draw a horizontal line meeting the curve at P.
Through P, a vertical line is drawn which meets OX at M.
OM = 226 units
Hence, median consumption of electricity = 226 units
Question 6.
Solution:

We plot the points (50, 100), (55, 98), (60, 90), (65, 78), (70, 54)and (75, 16) to get the ‘more than type’ ogive as follows:
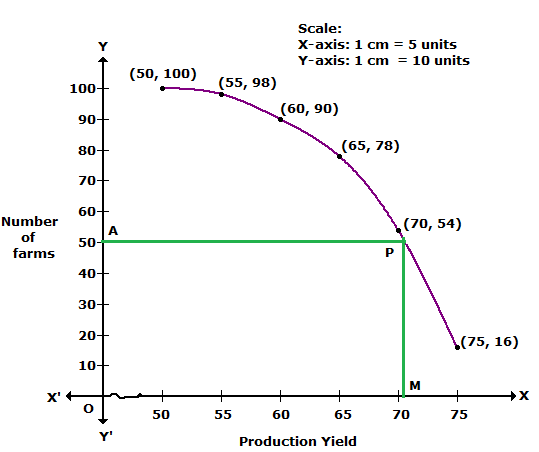
Here, N = 100 ⇒ N/2 = 50.
At y = 50, affix A.
Through A, draw a horizontal line meeting the curve at P.
Through P, a vertical line is drawn which meets OX at M.
OM = 70.5 units
Hence, median production yield = 70.5 kg/ha
Question 7.
Solution:
Less Than Series:
|
Class interval |
Cumulative Frequency |
|
Less than 200 |
5 |
|
Less than 300 |
11 |
|
Less than 400 |
22 |
|
Less than 500 |
35 |
|
Less than 600 |
40 |
|
Less than 700 |
44 |
|
Less than 800 |
47 |
|
Less than 900 |
49 |
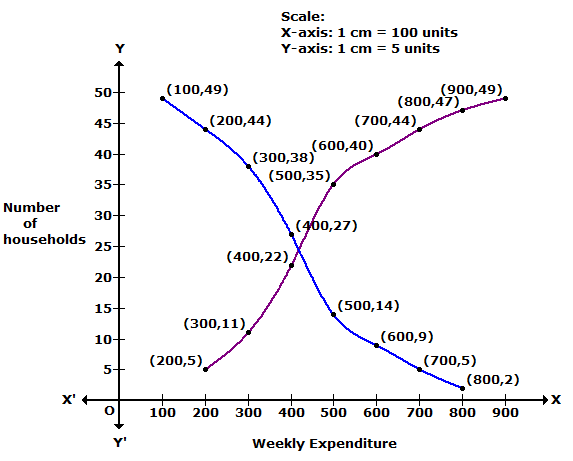
We plot the points (200, 5), (300, 11), (400, 22), (500, 35), (600, 40), (700, 44), (800, 47) and (900, 49) to get ‘less than type’ ogive.
More Than Series:
|
Class interval |
Frequency |
|
More than 100 |
49 |
|
More than 200 |
44 |
|
More than 300 |
38 |
|
More than 400 |
27 |
|
More than 500 |
14 |
|
More than 600 |
9 |
|
More than 700 |
5 |
|
More than 800 |
2 |
We plot the points (100, 49), (200, 44), (300, 38), (400, 27), (500, 14), (600,9), (700, 5) and (800, 2) to get more than ogive.
Question 8.
Solution:
More than series
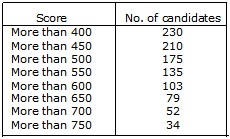
We plot the points (400, 230), (450, 210), (500, 175), (550, 135), (600, 103), (650, 79), (700, 52), (750, 34)
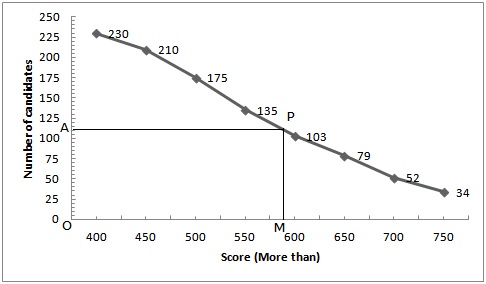
Hence,N = 230 ⇒ N/2 = 115.
Take a point A(0, 115) on the y-axis and draw AP||x-axis meeting the curve at P, Draw PM ⊥ x-axis intersecting x-axis at M
Then,OM = 590
Hence median = 590.
Question 9.
Solution:
(i) Less than series:
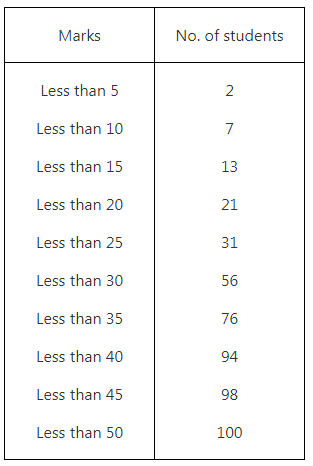
Plot the points (5, 2), (10, 7), (15, 13), (20, 21), (25, 31), (30, 56), (35, 76), (40, 94), (45, 98) and (50, 100)
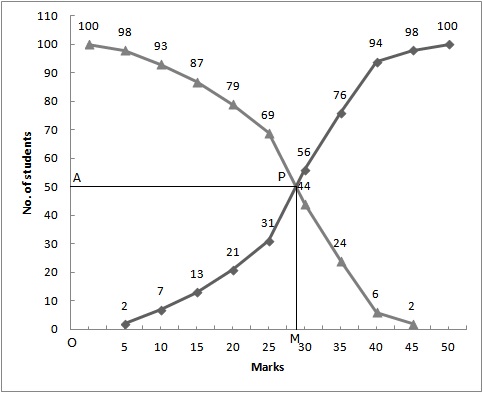
Join these points free hand to get the curve representing “less than” cumulative curve.
(ii)From the given table we may prepare the ‘more than’ series as shown below:
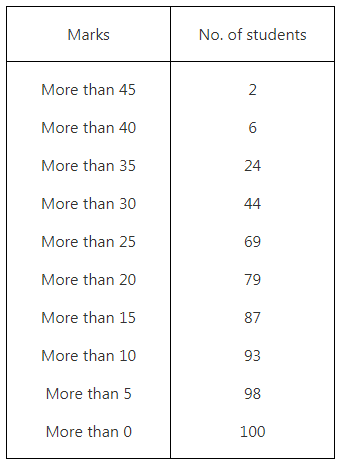
Now, on the same graph paper as above, we plot the point (0, 100), (5, 98), (10, 93), (15, 87), (20, 79), (25, 69), (30, 44), (35, 24) and (40, 6) and (45, 2)
Join these points free hand to get required curve
Here N = 100 ⇒ N/2 = 50
Two curves intersect at point P(28, 50)
Hence, the median = 28.
Question 10.
Solution:
We may prepare less than series and more than series
(i)Less than series :
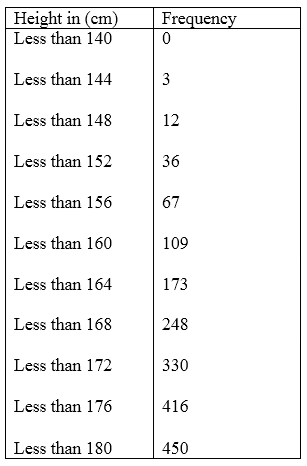
Now on graph paper plot the points (140, 0), (144, 3), (148, 12), (152, 36), (156, 67), (160, 109), (164, 173), (168, 248), (172, 330), (176, 416), (180, 450)
(ii)More than series :
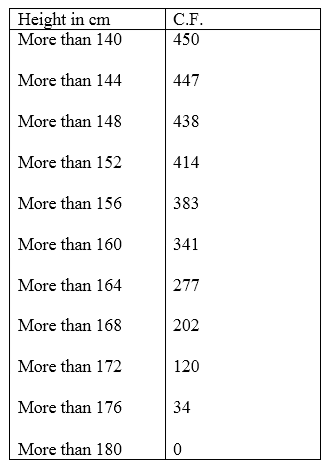
Now on the same graph plot the points (140, 450), (144, 447), (148, 438), (152, 414), (156, 383), (160, 341), (164, 277), (168, 202), (172, 120), (176, 34), (180, 0)
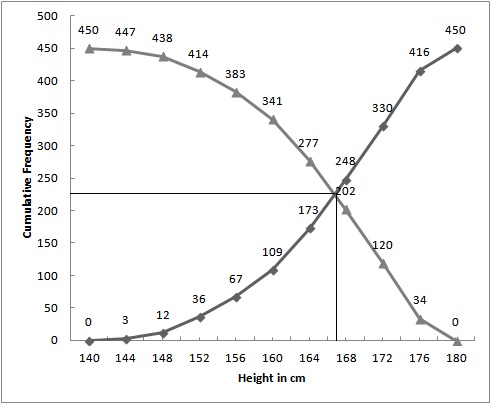
The curves intersect at (167, 225).
Hence, 167 is the median.
We hope the RS Aggarwal Solutions Class 10 Chapter 9 Mean, Median, Mode of Grouped Data Ex 9e help you. If you have any query regarding RS Aggarwal Solutions Class 10 Chapter 9 Mean, Median, Mode of Grouped Data Ex 9e, drop a comment below and we will get back to you at the earliest.