Here we are providing Class 12 Economics Important Extra Questions and Answers Chapter 4 Determination of Income and Employment. Economics Class 12 Important Questions are the best resource for students which helps in class 12 board exams.
Class 12 Economics Chapter 4 Important Extra Questions Determination of Income and Employment
Determination of Income and Employment Important Extra Questions Very Short Answer Type
Question 1.
Define Aggregate Demand. (C.B.S.E. 2010,2014)
Or
What is ‘Aggregate Demand’ in macroeconomics? (C.B.S.E Outside Delhi 2015)
Answer:
Aggregate Demand (AD) refers to the total expenditure on consumption and investment by different sectors of the economy.
Question 2.
How would you show Aggregate Demand in an equation?
Answer:
Aggregate Demand can be written in the form of the following equation:
AD = C + I + G + (X – M) where
C – Private Final Expenditure
I = Investment Expenditure
G = Government Expenditure
X – M = Net Exports (Exports – Imports)
Question 3.
Define Aggregate Supply.
Or
What is ‘Aggregate Supply’ in macroeconomics? (C.B.S.E 2015)
Answer:
Aggregate Supply (AS) refers to the planned aggregate production by the producers during a period of one year. It is equal to the income generated.
Question 4.
How would you show Aggregate Supply in an equation?
Answer:
Aggregate Supply can be written in the form of the following equation:
AS = Y = C + S
where; C – Consumption Expenditure
S = Savings
Question 5.
What are the two main constituents of AD?
Answer:
The two main constituents of AD are:
(i) Consumption
(ii) Investment
Question 6.
What are the two constituents of AS?
Answer:
The two main constituents of AD are:
(i) Consumption
(ii) Saving
Question 7.
Why does consumption curve not start from the origin? (C.B.S.E 2018)
Answer:
Consumption curve does not start from zero because people consume even at zero level of income.
Question 8.
Define MPC. (C.B.S.E 2014,2017)
Answer:
Marginal Propensity to Consume (MPC) is the ratio of change in consumption to the change in income; It is the slope of the consumption function.
Question 9.
What do you understand by APC?
Answer:
Average Propensity to Consume (APC) is the ratio of total consumption (C) to total income (Y).
\(M P C=\frac{\Delta C}{\Delta Y}\)
Question 10.
What do you understand byAPC?
Answer:
Average Propensity to Consume (APC) is the ratio of total consumption (C) to total income (Y).
\(\mathrm{APC}=\frac{\mathrm{C}}{\mathrm{Y}}\)
Question 11.
How is Average Propensity to Consume measured?
Answer:
Average propensity to consume (APC) is measured as below:
\(\mathrm{APC}=\frac{\text { Consumption }}{\text { Income }}=\frac{C}{Y}\)
Question 12.
Define APS.
Answer:
Average Propensity to Save (APS) is the ratio of total saving to total income
\(\mathrm{MPS}=\frac{\Delta \mathrm{S}}{\Delta Y}\)
Question 13.
What do you understand by MPS?
Answer:
Marginal Propensity to Save (MPS) is the ratio of change in saving to change in income.
\(\mathrm{MPS}=\frac{\Delta \mathrm{S}}{\Delta Y}\)
Question 14.
State the relationship between MPS and MPC.
Answer:
The sum of Marginal Propensity to Consume (MPC) and Marginal Propensity to Save (MPS) is always equal to one. That is,
MPC + MPS = 1
Question 15.
State the relationship between APC and APS.
Answer:
The sum of Average Propensity to Consume (APC) and Average Propensity to Save (APS) is always equal to one. That is, APC + APS = 1
Question 16.
What is consumption?
Answer:
Consumption refers to that part of income, which is spent by the households on the purchase of consumer goods and services.
Question 17.
What does a consumption function show?
Answer:
Consumption function shows the relationship between income and consumption.
Question 18.
Give the meaning of autonomous consumption.
Answer:
Autonomous consumption is the amount of consumption expenditure at zero level of income. It does not change with change in income.
Question 19.
Give the meaning of ex-ante savings. (C.B.S.E. 2010)
Answer:
Ex-ante savings refer to the level of savings, which is planned to be made by the households during a period of one year.
Question 20.
If planned savings are greater than planned investment what will be its effect on inventories?
Answer:
If planned savings are greater than planned investment, inventories will increase.
Question 21.
What are the two determinants of investment?
Answer:
The two determinants of investment are:
(i) Marginal Efficiency of Capital
(ii) Rate of interest
Question 22.
What is the main motive for investment in the private sector?
Answer:
Expected profitability is the main motive for investment in the private sector.
Question 23.
Define investment. (C.B.S.E. 2013 Comp.)
Answer:
Investment refers to purchase of new machines, new buildings and other capital goods that add to the existing stock of capital goods.
Question 24.
Give the meaning of ex-ante investment. (C.B.S.E 2010)
Answer:
Ex-ante investment refers to the investment, which is planned to be made by the firms during a period of one year.
Question 25.
If S exceeds I in an economy, what will be its effect on level of income?
Answer:
If S exceeds I in an economy then the level of income will decline.
Question 26.
If I exceeds S in an economy, what will be its effect on level of income?
Answer:
If I exceeds S in an economy then the level of income will increase.
Question 27.
Define Say’s law of markets.
Answer:
According to the Say’s law of markets, “Production is the source of demand.”
Question 28.
What is meant by full employment? (C.B.S.E Outside Delhi 2014)
Answer:
Full employment refers to a situation in which everyone who is willing to work at the existing wage rate gets work.
Question 29.
What is Keynes’s conception of full employment?
Answer:
According to Keynes, full employment exists when the Aggregate Supply function becomes perfectly inelastic in an economy.
Question 30.
How is full employment equilibrium determined?
Answer:
Full employment equilibrium is determined when Aggregate Demand function intersects the Aggregate Supply function on its perfectly inelastic part.
Question 31.
According to classical writers, what are the causes of involuntary unemployment?
Answer:
According to classical writers, involuntary unemployment appears in an economy due to wage rigidity, minimum wage laws and trade union activities.
Question 32.
What, according to Keynes, is the fundamental cause of involuntary unemployment?
Answer:
According to Keynes, the fundamental cause of involuntary unemployment in an economy is the deficient demand.
Question 33.
What is involuntary unemployment? (CBSE 2014,2017)
Answer:
The involuntary unemployment refers to a situation in which the workers are willing to work at the prevailing wage rates but the jobs are not available to them.
Question 34.
If MPC and MPS are equal, what is the value of the multiplier?
Answer:
The sum of MPC and MPS is always equal to I. That is,
MPC + MPS = I
When MPC = MPS, then the value of both of them will be:
\(M P C=M P S=\frac{1}{2}\)
The value of multiplier can be calculated as:
\(\begin{aligned}
K &=\frac{1}{M P S} \\
&=\frac{1}{\frac{1}{2}}=2
\end{aligned}\)
Thus, the value of the multiplier is 2.
Question 35.
What is investment multiplier?
Answer:
Investment multiplier (K) expresses the relationship between the final change in income and the initial change in investment. It is estimated as the ratio of change in income due to change in investment.
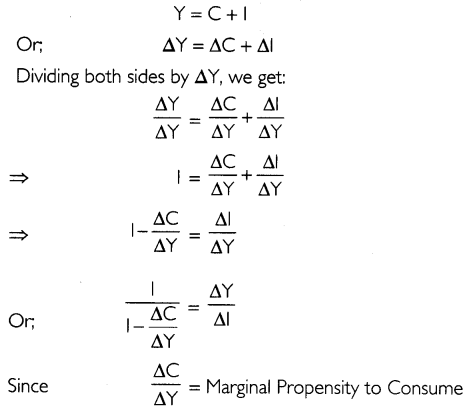
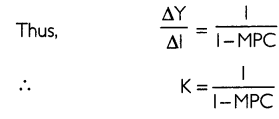
Question 36.
Whose value does \(\frac{1}{1-M P C}\) show?
Answer:
Investment Multiplier.
\(K=\frac{\Delta Y}{\Delta !}\)
Question 37.
Whose value does \(\frac{1}{\mathrm{MPS}}\) indicate?
Answer:
Investment multiplier.
Question 38.
What will be the value of multiplier, if MPS is 0.4?
Answer:
Investment multiplier \((K)=\frac{1}{M P S}\)
At MPS = 0.4,
\(K=\frac{1}{0.4}=\frac{10}{4}=2.5\)
Question 39.
What is the value of investment multiplier, if MPS = 0.8?
Answer:
Investment multiplier \((K)=\frac{1}{M P S}\)
At MPS = 0.8,
\(K=\frac{1}{0.8}=\frac{10}{8}=1.25\)
Question 40.
What will be the value of multiplier, if MPS = 0.5?
Answer:
Investment multiplier \((K)=\frac{1}{M P S}\)
At MPS = 0.5
\(K=\frac{1}{0.5}=\frac{10}{5}=2\)
Question 41.
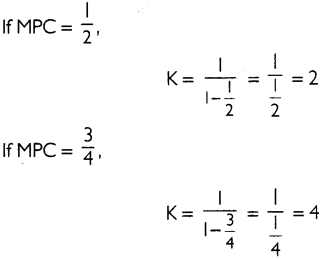
What is value of multiplier, if MPC is 0.9?
Answer:
Investment Multiplier \((\mathrm{K})=\frac{1}{1-\mathrm{MPC}}\)
At MPC = 0.9,
Question 42.
What is the value of multiplier, if MPC is 3/4?
Answer:
Investment Multiplier \(K=\frac{1}{1-0.9}=\frac{1}{0.1}=10\)
\(\begin{aligned}
M P C &=\frac{3}{4}, K=\frac{1}{1-3 / 4} \\
&=\frac{1}{1 / 4}=4
\end{aligned}\)
Question 43.
What can be the minimum value of investment multiplier?
Answer:
The minimum value of investment multiplier can be one.
Question 44.
If investment multiplier is one, what will be the value of Marginal Propensity to Consume?
Answer:
When investment multiplier is one, then the value of Marginal Propensity of Consume will be zero.
Question 45.
What is deficient demand?
Answer:
Deficient demand refers to a situation in the economy in which Aggregate Demand is less than the Aggregate Supply (AD < AS) at the fell employment level.
Question 46.
What is ‘excess demand’ in macroeconomics? (C.B.S.E Outside Delhi 2014)
Answer:
Excess demand refers to a situation in the economy in which the Aggregate Demand is more than the Aggregate Supply (AD > AS) at the fell employment level.
Question 47.
What is deflationary gap? (C.8.S.E Outside Delhi 2014)
Answer:
Deflationary gap refers to the excess of available supply of output over the anticipated expenditure at constant prices of base period.
Question 48.
Define inflationary gap.(C.B.S.E. Outside Delhi 2014)
Answer:
Inflationary gap refers to the excess of anticipated expenditure over the available supply of output at constant prices of base period.
Question 49.
How can the problems of excess and deficient demand be combated?
Answer:
The problems of excess and deficient demand may be combated through fiscal policy and monetary policy measures of the government.
Question 50.
What is meant by open market operations?
Answer:
Open market operation is the policy of the central monetary authority to sell and buy the government securities in the market.
Question 51.
What is bank rate or discount rate?
Answer:
Bank rate is the minimum rate at which the central bank discounts the first class bills of exchange and provides credit to the commercial banks.
Question 52.
What do you mean by margin requirement?
Answer:
Margin requirement of loan is the minimum security price charged by the commercial bank for granting
Question 53.
Suggest one monetary measure to correct excess demand.
Answer:
Bank rate can be increased to correct excess demand.
Question 54.
Give one fiscal measure to correct excess demand.
Answer:
Decrease government expenditure on subsidies and transfer payments.
Question 55.
Write one monetary measure to correct deficient demand.
Answer:
Buying government securities from commercial banks and general public.
Question 56.
Suggest one fiscal measure to correct deficient demand.
Answer:
Increase government expenditure on public welfare, defense, administration, etc.
Determination of Income and Employment Important Extra Questions Short Answer Type
Question 1.
What is meant by Aggregate Demand ? State its component.
Or
State and discuss the components of Aggregate Demand in a two sector economy. (C.B.S.E 2019)
Answer:
Aggregate Demand (AD) refers to the total expenditure on consumption and investment by different sectors of the economy.
Aggregate Demand comprises of the following components:
(i) Private Consumption Expenditure (C): Household expenditure on goods and services during an accounting year is called consumption expenditure. It depends upon the level of income of the households.
(ii) Investment Expenditure (I): Investment expenditure is the expenditure on goods by private investors, which add to their capital stock. These goods include producer’s durable, equipment, new construction and change in inventories.
(iii) Government Expenditure (G): Government expenditure, both consumption and investment, on public goods such as opening of schools, construction of roads, maintain law and order, provide justice, etc.
(iv) Net Exports (X – M): Net exports is the difference between total imports and total exports. Note: For a two-sector economy, state and discuss only C & I.
Question 2.
In an economy Aggregate Demand is greater than Aggregate Supply. Explain the changes that will take place in this economy. (C.B.S.E. 2011 Comp.)
Answer:
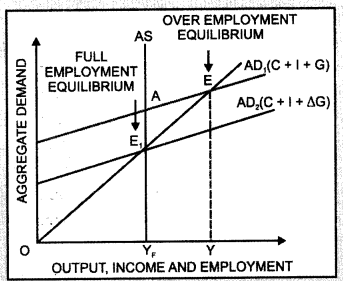
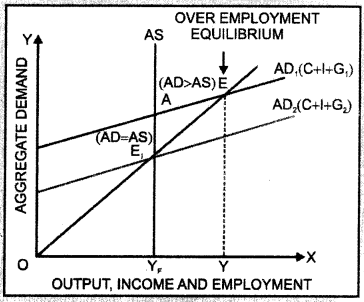
Excess demand refers to a situation in which Aggregate Demand in the economy is greater than the Aggregate Supply (AD > AS) at full employment level. The problem of excess demand can be corrected by contractionary fiscal or monetary policy. In the diagram, the initial Aggregate Demand curve is AD.
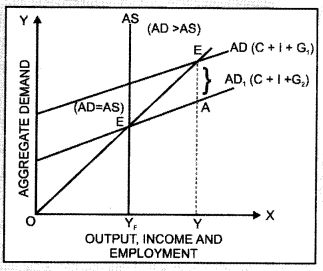
Aggregate Supply (AS) is a vertical line at the full employment level of output (YF). With the initial government expenditure of G1; the Aggregate Demand is OY while Aggregate Supply is OYF. There is a situation of excess demand of EA. As government expenditure is decreased to G2, AD curve shifts down until equilibrium is attained (AD = AS) at full employment level of output.
Thus, the problem of excess demand or inflationary gap can be corrected by decreasing public expenditure. As government expenditure is decreased to G2, AD curve shifts down until equilibrium is attained (AD = AS) at full employment level of output Thus, the problem of excess demand or inflationary gap can be corrected by decreasing public expenditure.
Question 3.
In an economy Aggregate Demand is less than Aggregate Supply. Explain the changes that will take place in this economy. (C.B.S.E Outside Delhi 2011 Comp.)
Answer:
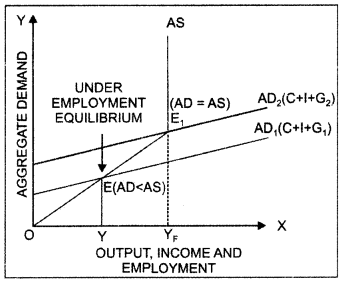
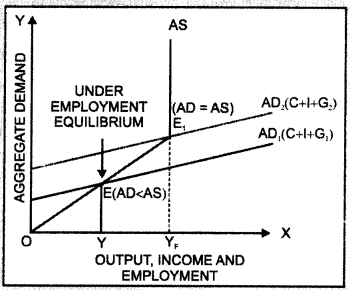
Deficient demand refers to a situation in which Aggregate Demand in the economy is less than the Aggregate Supply (AD < AS) at full employment level. Deficient demand is also known as deflationary gap.
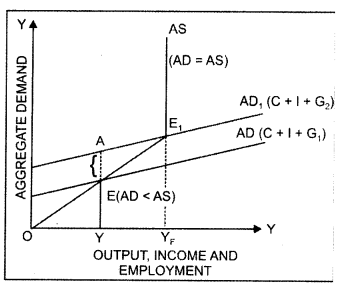
In the diagram, the initial Aggregate Demand curve is AD. Aggregate Supply (AS) is a vertical line at the full employment level of output (YF). With the initial government expenditure of G1 the Aggregate Demand is OY while Aggregate Supply is OYp. There is a situation of deficient demand of AE. As government expenditure is increased to G2, AD curve shifts up until equilibrium
Question 4.
Discuss the working of the adjustment mechanism in the following situations:
(a) Aggregate demand is greater than Aggregate supply.
(b) Ex Ante Investments are lesser than Ex Ante Savings. (C.B.S.E 2019)
Answer:
(a) When Aggregate Demand is greater than Aggregate Supply, buyers are planning to buy more goods and services than what producers are planning to produce. It will lead to fall in planned inventory below the desired level. The producers, in turn, will produce more which will increase the aggregate supply till aggregate demand becomes equal to aggregate supply.
(b) Ex-ante investment are lesser than Ex-ante savings, meaning buyers are planning to buy lesser output as to what producer are planning to produce. It will lead to rise in planned inventory above the desired level. As a result, the producers will cut down production leading to a reduction of income till saving becomes equal to investment.
Question 5.
Distinguish between Average Propensity to Consume and Marginal Propensity to Consume. The value of which of these two can be greater than one and when?
Answer:
Average Propensity to Consume (APC) is the ratio of total consumption (C) to total income (Y).
\(\mathrm{APC}=\frac{C}{\mathrm{Y}}\)
Marginal Propensity to Consume (MPC) is the ratio of change in consumption to the change in income. It is the slope of the consumption function.
\(M P C=\frac{\Delta C}{\Delta Y}\)
The value of APC can be greater than one when current consumption exceeds current income.
Question 6.
Give the meaning of Marginal Propensity to Save and Average Propensity to Save. Can the value of Average Propensity to Save be negative? If yes, when?
Answer:
Marginal Propensity to Save (MPS) is the ratio of change in saving to change in income.
\(\mathrm{MPS}=\frac{\Delta \mathrm{S}}{\Delta Y}\)
Average Propensity to Save (APS) is the ratio of total saving to total income.
\(\mathrm{APS}=\frac{\mathrm{S}}{\mathrm{Y}}\)
APS can be negative in situations when saving is negative or when consumption is greater than income.
Question 7.
Distinguish between Average Propensity to Save and Marginal Propensity to Save.The value of which of these two can be negative and when?
Answer:
Average Propensity to Save (APS) is the ratio of total saving to total income.
\(\mathrm{APS}=\frac{\mathrm{S}}{\mathrm{Y}}\)
Marginal Propensity to Save (MPS) is the ratio of change in saving to change in income.
\(\mathrm{APS}=\frac{\mathrm{S}}{\mathrm{Y}}\)
The value of APS can be negative when saving is negative or when consumption is greater than income.
Question 8.
What is the relationship between Average Propensity to Consume and Average Propensity to Save? Can the value of average propensity to save be negative? If yes, when?
Answer:
Average Propensity to Consume (APC) is the ratio of total consumption (C) to total income (Y).
\(\mathrm{APC}=\frac{\mathrm{C}}{\mathrm{Y}}\)
Average Propensity to Save (APS) is the ratio of total saving to total income.
\(\mathrm{APS}=\frac{\mathrm{S}}{\mathrm{Y}}\)
Relationship between APC and APS
We know that, Y = C + S
Dividing both sides by Y, we get:
\(\frac{Y}{Y}=\frac{C}{Y}+\frac{S}{Y}\)
Substituting APC = \(\frac{C}{Y}\) and APS = \(\frac{S}{Y}\), we get:
APC + APS = 1
Thus, the sum of the APC and APS is always equal to one. This is because total income is either consumed or saved.
The value of APS can be negative when saving is negative or when consumption is greater than income.
Question 9.
Outline the steps taken in deriving saving curve from the consumption curve. Use diagram. (C.B.S.E. Outside Delhi 2017) (C.B.S.E. 2012, 14)
Answer:
Income is the sum of consumption and saving. The relationship among the three can be expressed as:
Y = C + S
Saving curve can be derived from the consumption curve. The derivation can be explained with the help of the given diagram. In the diagram, CC is the consumption curve and the 45° line represents income.
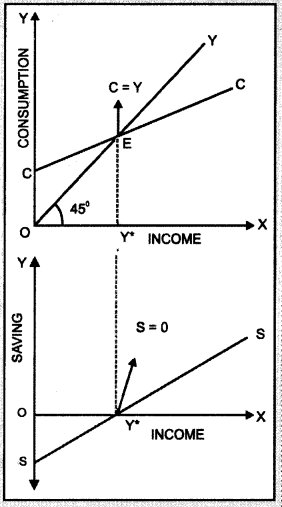
OC is autonomous consumption, that is, the amount of consumption at zero level of income (C > Y). This is equal to the amount of saving (OS) at zero level of income. The saving is negative and the saving curve is below the horizontal axis.
Income and CC curves intersect at OY* level of income (point E) implying that consumption is equal to income at E. It is called the break-even point. At this point, saving is zero.
Beyond OY* level of income, consumption is less than income (C < Y). Thus, saving is positive and the saving curve is above the horizontal axis. SS is the saving curve derived from consumption curve.
Question 10.
Outline the steps taken in deriving consumption curve from the saving curve. Use diagram.
Answer:
Income is the sum of consumption and saving. The relationship among the three can be expressed as:
Y = C + S
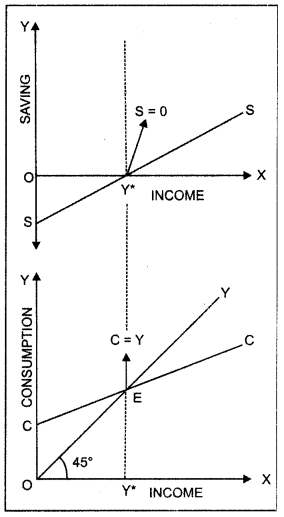
Consumption curve can be derived from the saving curve. The derivation can be explained with the help of the given diagram. In the given diagram, SS is the saving curve. OS represents negative saving and the saving curve is below the horizontal axis. When amount of saving is negative, consumption is greater than income (C > Y).
This is equal to the amount of consumption (OC) at zero level of income. The saving is zero at OY* level of income (point E) implying that consumption is equal to income at E. It is called the break-even point. At E, income and CC curves intersect each other.
Beyond OY* level of income, saving is positive and the saving curve is above the horizontal axis. When the amount of saving is positive, consumption is less than income (C < Y). Thus, CC is the consumption curve derived from saving curve.
Question 11.
Distinguish between consumption function equation and saving function equation. (C.B.S.E. 2012)
Answer:
Consumption Function Equation
The relationship between the consumption and the income is called the consumption function. The consumption function may be represented by the following equation:
C = a + bY; a > 0, 0 < b < I
C = Consumption Expenditure
Y = Level of income
a = Autonomous Consumption
b = Slope of consumption function \(\left(\mathrm{MPC}=\frac{\Delta \mathrm{C}}{\Delta \mathrm{Y}}\right)\)
Autonomous consumption is the amount of consumption expenditure at zero level of income. It is the intercept of the consumption expenditure and is assumed to be positive as people consume even at the zero level of income.
Marginal Propensity to Consume (MPC) orb is the slope of the consumption function. It measures the rate of change in consumption per unit change in income. The value of MPC is positive and lies between 0 and I. This means that the consumption increases with the income.
Saving Function Equation
The relationship between saving and income is called the saving function. The following identity expresses the relationship between saving (S) and income (Y).
Y ≡ C + S
On S = Y – C …(I)
The consumption function is represented as:
C = a + bY
Substituting (2) in (1); we get
S = Y – (a + bY)
S = Y – a – bY
S = – a + (1 – bY)
S = Saving
a = Amount of saving when level of income is zero
(1- b) = Slope of the saving function \(\left(\mathrm{MPS}=\frac{\Delta \mathrm{S}}{\Delta Y}\right)\)
Question 12.
Distinguish between propensity to consume and propensity to save, with the help of numerical example. (C.B.S.E Outside Delhi 2012)
Answer:
Marginal Propensity to Consume (MPQ is the ratio of change in consumption to the change in income.
\(\mathrm{MPC}=\frac{\Delta C}{\Delta Y}\)
Marginal Propensity to Save (MPS) is the ratio of change in savings to the change in income.
\(M P S=\frac{\Delta S}{\Delta Y}\)
The sum of the propensity to consume and propensity to save is always equal to one.
MPC + MPS = 1
Or; MPC = 1 – MPS
Or; MPS = 1 – MPC
MPC and MPS are inversely related. Higher the propensity to consume lower will be the propensity to save and vice-versa. For example, suppose propensity to consume is 0.80. The propensity to save will be
MPS = 1 – 0.80
= 0.20
If propensity to consume falls to 0.40, then the propensity to save will be
MPS = 1 – 0.40
= 0.60
Question 13.
What are induced and autonomous investments?
Answer:
Induced Investment Induced investment is the investment, which is affected by the changes in income and production in the economy. At higher level of income, the demand for goods is high and hence, the rate of profit increases. Investment automatically increases while rate of profit increases.! Autonomous Investment Autonomous investment is the investment, which is not affected by the changes in income, rate of interest or rate of profits. In other words, autonomous investment is income inelastic. Autonomous investment is increased to provide education, health, etc. facilities to increasing population.
Question 14.
Describe briefly the determinants of investment.
Answer:
Following are the determinants of investment;
(i) Marginal Efficiency of Capital: Marginal efficiency of capital refers to the decline in cost of production by employing an additional unit of capital.
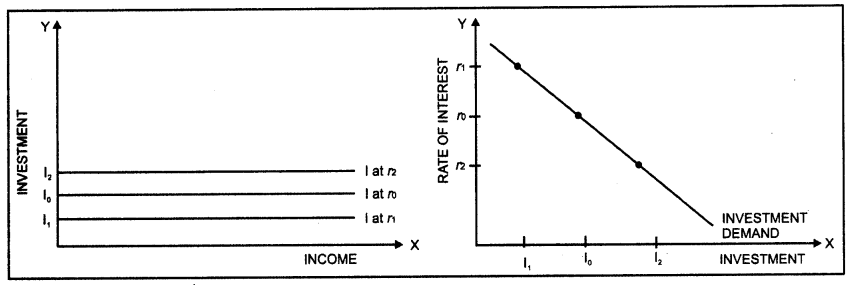
(ii) Rate of Interest: Rate of interest is an important determinant of investment. Rate of interest and investment demand are inversely related as the demand for investment decreases when rate of interest increases and vice-versa.
Question 15.
Draw and explain an investment demand curve.
Answer:
Rate of interest is an important determinant of investment. Rate of interest and investment demand are inversely related. The demand for investment decreases when the rate of interest is high. Similarly, the demand for investment increases when the rate of interest is low. This inverse relationship between the rate of interest and the level of investment is illustrated in the Investment Demand Curve shown below:
Question 16.
Explain the determination of equilibrium level of income using the ‘saving-investment’ approach. Use diagram.
Answer:
The equilibrium is determined at the level of income where Aggregate Demand is equal to the Aggregate Supply. That is,
AD = AS ………….. (1)
AD = C + 1 ………….. (2)
AS = C + S ………….. (3)
By substituting (2) and (3) in (1), we get;
C + I = C + S
I = S
Thus, the equilibrium level of income and output is attained when planned saving (S) and planned! investment (I) are equal. The determination of equilibrium level of income using saving-investment approach can be explained with the help of a diagram.
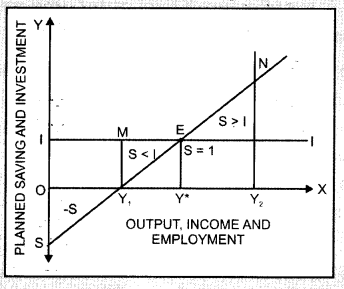
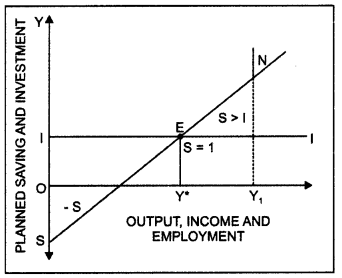
In the diagram, SS is the saving curve that shows planned saving at different levels of income. It is the investment curve that shows investment as given and constant.
Planned saving and investment are equal (S = I) at point E. Corresponding to this point, OY* is the equilibrium
level of income and output.
At OY! level of output, planned saving is less than planned investment (S < I). It implies that at this level of income, what businessmen plan to invest is more than what households plan to save. There is a situation of excess demand in the economy. Thus, producers will decrease inventory and output would expand until equilibrium is attained.
Similarly, at OY2 level of output, planned saving is greater than planned investment (S > I). It implies that at this level of income, what businessmen plan to invest is less than what households plan to save. There is a situation of deficient demand in the economy. Thus, producers will increase inventory and output would contract until equilibrium is attained.
Question 17.
Can an economy be in a state of underemployment equilibrium? Explain with the help of a diagram.
Answer:
Yes, an economy can be in a state of underemployment equilibrium. Equilibrium is attained when planned expenditure is equal to the planned output in the economy.
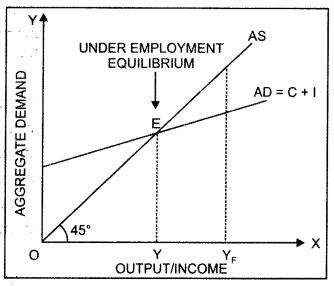
If this equality is achieved at a level less than full employment level of output then the economy will be in a situation of underemployment equilibrium.
C + I curve shows Aggregate Demand (AD) at different levels of output. OY is the underemployment level of output and OYF is the full employment level of output. The – OY level of output is sufficient to meet current Aggregate Demand. Thus, at OY level of output the economy is in equilibrium but it is a situation of underemployment equilibrium.
Question 18.
Explain any one type of unemployment, which exists during full employment.
Answer:
Full employment refers to a situation in which everyone who is willing to work at. the existing wage rate gets work. Structural Unemployment may exist even during full employment. It is the position of unemployment, which originates for some time because of the change in structural system of an economy. Structural unemployment occurs when there is a lack of other factors of production, change in technique of production or lack of training of labourers.
Question 19.
Describe Say’s law of Market.
Answer:
French economist Jean-Baptiste Say has done himself immortal in 1803 by inventing this law in the book, “Treatise on Political Economy”. According to the Say’s law of market, “Production is the source of demand.” When an individual produces a good or service, he or she gets paid for that work. He is then able to use the return to demand other goods and services. There will never be over production in the economy and full employment remains in economy.
Question 20.
Define multiplier. What is the relation between marginal propensity to consume and multiplier? Calculate the marginal propensity to consume if the value of multiplier is 4. (C.B.S.E. 2018)
Answer:
Multiplier or Investment multiplier (K) expresses the relationship between the final change in income and the initial change in investment. It is estimated as the ratio of change in income due to change in
investment. A change in investment causes a ‘multiple’ change in the output.
\(\begin{array}{l}
K=\frac{\Delta l}{\Delta Y} \\
\Delta l=K \times \Delta Y
\end{array}90\)
There is a direct relationship between investment multiplier and Marginal Propensity to Consume (MPC). The extent of the effect of multiplier depends upon MPC. Higher the MPC, higher will be the value of multiplier. The relationship between investment multiplier and MPC can be expressed with the help of the following equation:
\(K=\frac{1}{1-M P C}\) …………….. (1)
Since the value of MPC lies between 0 and I (0 < MPC < I), the value of multiplier will always be greater than one.
Substituting K = 4 (i), we get:
\(\begin{array}{r}
4=\frac{1}{1-M P C} \\
\mid-M P C=\frac{1}{4}=0.25
\end{array}
MPC = 1-0.25 = 0.75\)
Thus, at K = 4, MPC = 0.75.
Question 21.
Explain the working of investment multiplier with the help of a table.
Answer:
Investment multiplier (K) expresses the relationship between the final change in income and the initial change in investment It is estimated as the ratio of change in income due to change in investment A. change in investment causes a ‘multiple’ change in the output.
\(\begin{array}{l}
\mathrm{K}=\frac{\Delta \mathrm{l}}{\Delta \mathrm{Y}} \\
\Delta \mathrm{I}=\mathrm{K} \times \Delta \mathrm{Y}
\end{array}\)
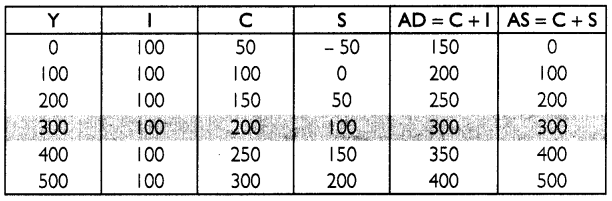
Assume that the MPC is 4/5. Further, suppose that there is an increase in investment worth ₹ 100, which results in the construction of a new building. This processes can be shown with the help of following table:
| Time Period Increase in crores | Initial in Investment Expenditure | Change in Income | Induced Change in Consumption (MPC = 0.8) | Saving (in crores) |
| 1. | 100 | 100 | 80 | 20 |
| 2. | — | 80 | 64 | 16 |
| 3 | — | 64 | 51.2 | 12.8 |
| 4. | — | 51.2 | 49.96 | 10.24 |
| 5. | — | 49.96 | 32.77 | 8.19 |
| 6. | — | 32.77 | 26.22 | 6.55 |
| .. | — | x | x | x |
| .. | — | . | . | . |
| .. | — | . | . | . |
| Total | 500 | 400 | 100 |
Here MPC = 0.8
Thus investment multiplier (k) = \(\frac{1}{\mathrm{MPS}}\)
Thus \(=\frac{1}{1-0.8}=\frac{1}{0.2}=5\)
Question 22.
State whether the following statements are true or false. Give reasons for your answer.
(i) When MPC is greater than MPS, the value of investment multiplier will be greater than 5
(ii) The value of MPS can never be negative. (C.B.S.E. 2010)
Answer:
(i) False. When MPC is greater than MPS, the value of investment multiplier will be greater than 2. Higher the value of MPC, higher will be the value of investment multiplier. For all the values of MPC > MPS, the value of investment multiplier will lie between 2 and infinity.
(ii) True. The value of MPS can never be negative. The relationship between MPC and MPS states that their sum is unity (MPC + MPS = 1). Moreover, the value of MPC lies between the range of 0 to 1, and so MPC can never be less than 0. Since MPC can never be less than 0, the value of MPS can also never be less than 0.
Question 23.
Giving reasons, state whether the following statements are true or false:
(i) When MPC is zero, the value of investment multiplier will also be zero.
(ii) Value of APS can never be less than zero. (C.B.S.E. 2010)
Answer:
(i) False. The relationship between investment multiplier and Marginal Propensity to Consume (MPC) is given as:
The ratio of MPC to MPS is 4 : 1 That is,
\(\frac{M P C}{M P S}=\frac{4}{1} \) ………………..(1)
Question 24.
State whether the following statements are true or false. Give reasons for your answer.
(i) When MPC is greater than MPS, the value of investment multiplier will be greater than 5
(ii) The value of MPS can never be negative. (C.B.S.E. 2010)
Answer:
(i) False. When MPC is greater than MPS, the value of investment multiplier will be greater than 2. Higher the value of MPC, higher will be the value of investment multiplier. For all the values of MPC > MPS, the value of investment multiplier will lie between 2 and infinity.
(ii) True. The value of MPS can never be negative. The relationship between MPC and MPS states that their sum is unity (MPC + MPS = I). Moreover, the value of MPC lies between the range of 0 to I, and so MPC can never be less than 0. Since MPC can never be less than 0, the value of MPS can also never be less than 0.
Question 25.
Giving reasons, state whether the following statements are true or false:
(i) When MPC is zero, the value of investment multiplier will also be zero.
(ii) Value of APS can never be less than zero. (C.B.S.E. 2010)
Answer:
(i) False. The relationship between investment multiplier and Marginal Propensity to Consume (MPC) is given as:
\(\begin{aligned}
K &=\frac{1}{1-M P C} \\
\text { At MPC=0, } & \\
K &=\frac{1}{1-0} \\
&=1
\end{aligned}\)
Thus, when MPC is zero the value of investment multiplier will be equal to one. The lowest value of multiplier is one.
(ii) False. The value of APS can be less than zero. APS can be negative in situations when saving is negative or when consumption is greater than income.
Question 26.
Giving reasons, state whether the following statements are true or false:
(i) If the ratio of Marginal Propensity to Consume and Marginal Propensity to Save is 4 :1 ,the value of investment multiplier will be 4.
(ii) Sum of APC and MPC is always equal to I.
Ans.
(i) False. It can be shown as below:
The ratio of MPC to MPS is 4 : 1 That is,
\(\frac{M P C}{M P S}=\frac{4}{1} \) ………………..(1)
The sum of MPC and MPS is always equal to one. That is,
MPC + MPS = 1
Substituting the (1) in (2); we get
4 MPS + MPS = 1
5 MPS = 1
MPS = \(\frac{1}{5}\)
MPS = 0.2
The relationship between investment multiplier and Marginal Propensity to Save (MPS) is given as:
\(\begin{aligned}
K &=\frac{1}{1-M P C} \\
&=\frac{1}{M P S} \\
K &=\frac{1}{0.2}=5
\end{aligned}\)
Thus, when the ratio Marginal Propensity to Consume and Marginal Propensity to Save is 4 :1, the value of investment multiplier will be equal to 5.
(ii) False. Average Propensity to Consume is the ratio of total consumption \(\left(A P C=\frac{C}{Y}\right)\), while Marginal Propensity to Consume is the ratio of change in consumption to the change in income \(\left(\mathrm{MPC}=\frac{\Delta \mathrm{C}}{\Delta \mathrm{Y}}\right)\). These two are entirely different concepts and cannot be added.
Question 27.
Show inflationary gap with the aid of a diagram. (C.B.S.E. 2005,2013 (Comp.), C.B.S.E Outside Delhi 2012)
Or
Explain the problem of excess demand.
Answer:
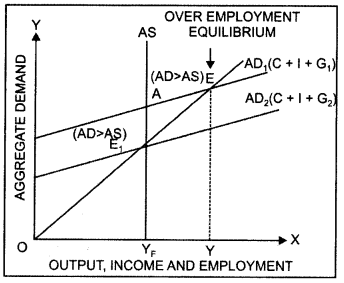
Inflationary gap refers to the excess of anticipated expenditure (Aggregate Demand) over the available supply of output (Aggregate Supply) at constant prices of base period. It measures the gap between AD and AS at full employment level of output. Since Aggregate Demand remains more than essential demand at full employment level, there is a significant increment in monetary income.
Thus, there is an over employment equilibrium. This, increases the Aggregate Demand but production cannot be increased as Aggregate Supply is perfectly inelastic. The problem of excess demand can be explained with the help of a diagram.
.
In the diagram, point E represents the state of over employment equilibrium in the economy. At E, the gap between Aggregate Demand and Aggregate Supply is AE1. That is, AE1 is the excess demand. The problem of excess demand can be corrected only by the interference of the government, say, by increasing taxes and reducing public expenditure.
Question 28.
Show with the help of a diagram — deflationary gap. (C.B.S.E 2005,2013 Comp. C.B.S.E Outside Delhi 2012)
Answer:
Deflationary gap refers to the excess of available supply of output (Aggregate Supply) over the anticipated expenditure (Aggregate Demand) at constant prices of base period. It measures the gap between AD and AS at full employment level of output. Since Aggregate Demand remains less than essential demand at full employment level, the problem of involuntary unemployment takes place. Thus, there is an under employment equilibrium.
The problem of deficit demand can be explained with the help of a diagram. In the diagram, point E represents the state of under employment equilibrium in the economy. At E, AD = AS but QYF level of unemployment prevails in the economy. At full employment level of output (OYF), the gap between Aggregate Demand and Aggregate Supply is AEr That is, AE, is the deficit demand. The problem of deficit demand can be corrected only by the interference of the government, say, by decreasing taxes and increasing public expenditure.
Question 29.
Explain the effects of excess demand on output, employment and prices.
Answer:
Excess demand has following effects:
(i) Effect on Output: Due to excess demand in an economy, the resources are over utilised. Production is maximum and cannot be increased further.
(ii) Effect on Employment: The economy has already achieved full employment level and hence, there is no involuntary unemployment in the economy. The employment level will not change during the situation of excess demand.
(iii) Effects on Prices: Since excess demand generates pressure on existing flow of goods and services in the economy, the prices will rise.
Question 30.
Explain the effects of deficient demand on production, employment and prices.
Answer:
Deficient demand has following effects:
(i) Effect on Output: Deficient demand exists due to underemployment in an economy. Some re¬sources remain unemployed and hence, output level is low.
(ii) Effect on Employment: Deficient demand causes level of investment to fall. As a result, there is involuntary unemployment in the economy, which decreases the level of employment.
(iii) Effects on Prices: Due to deficient demand prices tend to fall.
Question 31.
State the impact of “Excess Demand” under the Keynesian theory on employment, in an economy. (C.B.S.E Outside Delhi 2019)
Answer:
Excess demand refers to a situation in the economy in which the Aggregate Demand is more than the Aggregate Supply (AD > AS) at the full employment level. Since the economy is already operating at full employment level, excess demand will only lead to a genaral) rise in price level. Employment will not increase.
Question 32.
Differentiate between deficient demand and excess demand.
Answer:
There are the following differences between deficient demand and excess demand:
| S.No. | Deficient Demand | Excess Demand |
| 1. | Deficient demand takes place when AD < AS at full employment level of output | Excess demand takes place when AD > AS at full employment level of output. |
| 2. | Underemployment equilibrium causes involuntary unemployment in economy. | Over full employment equilibrium signifies overutilisation of resources. |
| 3. | Deficient demand creates deflationary gap. | Excess demand creates inflationary gap. |
| 4. | Due to deficient demand, there is a depreciation in trade cycle. | Excess demand causes a state of boom. |
| 5. | Production, income, employment and prices are low during deficient demand. | Production and employment are stable during excess demand while prices increase. |
Question 33.
Explain the meaning and implications of a deflationary gap. (C.B.S.E. Outside Delhi 2011 Comp.)
Answer:
Deflationary gap refers to the excess of available supply of output (Aggregate Supply) over the anticipated expenditure (Aggregate Demand) at constant prices of base period. It measures the gap between AD and AS at full employment level of output. Since Aggregate Demand remains less than essential demand at full employment level, the problem of involuntary unemployment takes place. Thus, there is an under employment equilibrium.
Following are the implications of deflationary gap:
(i) Deficient demand exists due to underemployment in an economy. Some resources remain unemployed and hence, output level is low.
(ii) Deficient demand causes level of investment to fall. As a result, there is involuntary unemployment in the economy, which decreases the level of employment.
(iii) Due to deficient demand prices tend to fall.
Question 34.
What is fiscal policy? How is it used to reduce excess demand in the economy?
or
Explain briefly three fiscal measures to reduce inflationary gap.
Answer:
Fiscal policy refers to the revenue and expenditure policy of the government to achieve balance in the development of the economy.
Following fiscal policy measures can be taken to reduce excess demand in the economy:
- Decrease in Government Expenditure: The government should reduce its unnecessary expenditure in order to check excess demand. Transfer payments should be decreased.
- Increase in Taxes: To correct excess demand, the government should levy new taxes and enhance the rate of existing taxes.
- Surplus Budget Policy: It is necessary that government expenditure should be less than its income: in order to correct excess demand.
Question 35.
What is fiscal policy? What possible fiscal policy measures can be taken with respect to expenditure and income to correct:
(i) Excess Demand
(ii) Deficient Demand
Answer:
Fiscal policy refers to the revenue and expenditure policy of the government to achieve balance in the development of the economy.
(i) Fiscal Measures to Correct Excess Demand
- Decrease government expenditure on public welfare, defence, administration, etc.
- Decrease government expenditure on subsidies and transfer payments
- Increase in tax rates
- Restrict deficit financing
(ii) Fiscal Measures to Correct Deficient Demand
- Increase government expenditure on public welfare, defence, administration, etc.
- Increase government expenditure on subsidies and transfer payments
- Reduce tax rates
- Increase deficit financing
Question 36.
What is monetary policy? Briefly explain how it can be used to reduce excess demand in an economy.
Answer:
Monetary policy refers to the regulation policy of the government (central bank) to control money supply and interest rate in the economy. Following monetary policy measures can be taken to reduce excess demand in the economy:
(i) Increase in Legal Reserve or Cash Reserve Ratio: The central bank increases the CRR to correct the situation of excess demand or inflationary gap in the economy. High CRR reduces the supply of money in the economy, and thus, the Aggregate Demand will fall.
(ii) Increase in Bank Rate: The central bank increases the bank rate to correct the situation of excess demand in the economy. Higher bank rate reduces the lending capacity of the commercial banks as they get funds at a higher interest rate from the central bank Consequently, money supply contracts in the economy as the public borrows less at high rate of interest and Aggregate Demand falls.
(iii) Open Market Operations: The central bank buys government securities from commercial banks and general public in a bid to correct the situation of excess demand. This decreases the stock of high powered money in the economy. As a result, the purchasing power of the people fall, which decreases the Aggregate Demand in the economy.
(iv) Increase in Margin Requirement: An increase in margin requirement will correct the situation of excess demand in the economy. Higher margin requirement implies higher security price for a loan. Thus, people will borrow less loans from the banks and the Aggregate Demand will decrease.
Question 37.
How can deficient and excess demand be corrected by change in taxes?
Answer:
Change in taxes can be corrected by excess demand in the following ways:
(i) Decrease in Taxes: Decrease in taxes increases the income of public, which increases ‘their
purchasing power. As a result, demand for goods and services increases. This can correct deflationary gap or deficient demand. Taxes should be progressive i.e. higher rate of tax for rich people than poor people.
(ii) Increase in Taxes: Increase in taxes (direct and indirect) will decrease the purchasing power of consumers and producers. This will decrease the Aggregate Demand. Therefore, government should implement new taxes for solving the problems of excess demand or inflationary gap or government should increase the rate of taxes.
Question 38.
Explain the role of ‘reverse repo rate’ in removing excess demand.
Answer:
Reverse repo rate refers to the rate at which central bank borrows from the commercial banks. The central bank increases the reverse repo rate to correct the situation of excess demand. Higher reverse repo rate would induce commercial banks to lend more to the central bank and hence, would reduce the supply of money in the economy. As a consequence, Aggregate Demand would fall.
Determination of Income and Employment Important Extra Questions Long Answer Type
Question 1.
Explain the concepts of Aggregate Demand and Aggregate Supply with the help of diagram.
Answer:
Aggregate Demand: Aggregate Demand (AD) refers to the total expenditure on consumption and investment by different sectors of the economy.
Aggregate Demand can be written in the form of the following equation:
AD = C + I + G + (X – M) Y
where; C = Private Final Expenditure
I = Investment Expenditure
G = Government Expenditure
X – M = Net Exports (Exports – Imports)
Aggregate Demand and price level has inverse relation.
That is, at higher price level, Aggregate Demand will be oc less and at lower price level, Aggregate Demand will be high. It can be explained with the help of following diagram.
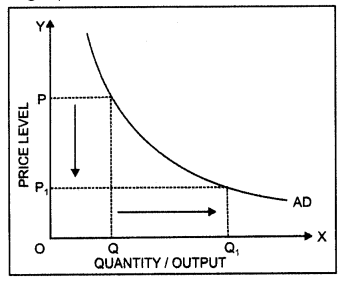
In this diagram, on OX axis shows the quantity and OY axis shows the price level. AD is the downward sloping Aggregate Demand curve.
Aggregate Supply: Aggregate Supply (AS) refers to the planned aggregate production by the producers during a period of one year. It is equal to the income generated.
Aggregate Supply can be written in the form of the cc following equation:
AS = Y = C + S
where; C = Consumption Expenditure
S = Savings
Following are the two types of concepts of Aggregate Supply:
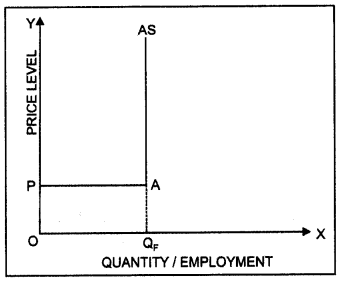
(i) Classical Concept of Aggregate Supply: According to classical economists such as Adam Smith, Marshall and Pigou etc., there is no relation between Aggregate Supply and price level. They had considered Aggregate Supply curve as perfectly inelastic cun/e. According to the classical outlook, an economy always functions at the full employment level of output.
(ii) Keynesian Concept of Aggregate Supply: In Keynesian concept of Aggregate Supply, the AS curve (in response to price level) is perfectly elastic before employment level. It means that all producers are ready to produce any quantity of production on market prices.
The Aggregate Supply curve is perfectly elastic due to inflexibility of prices and wages and constant Marginal Productivity of Labour. However, Aggregate Supply curve is perfectly inelastic in response to price level after full employment level.
In this diagram, part PA is perfectly elastic. Here, Marginal Productivity of Labour is stable. Production is going on at constant cost. OQF level is the full employment level. Beyond this level, Aggregate Supply curve becomes perfectly inelastic in response to price level.
Question 2.
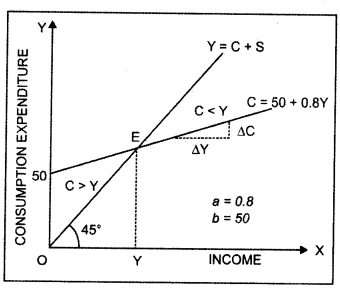
Explain ‘consumption function’ with the help of a schedule and diagram. (C.B.S.E 2008)
Answer:
The relationship between the consumption and the income is called the consumption function. The consumption function may be represented by the following equation:
C = a + bY; a > 0, 0 < b < I
C = Consumption Expenditure
Y = Level of income
a = Autonomous Consumption
b = Slope of consumption function \(\left(M P C=\frac{\Delta C}{\Delta Y}\right)\)
Autonomous consumption is the amount of consumption expenditure at zero level of income. It is the intercept of the consumption expenditure and is assumed to be positive as people consume even at the zero level of income. Marginal Propensity to Consume (MPC) orb is the slope of the consumption function. It measures the rate of change in consumption per unit change in income. The value of MPC is positive and lies between 0 and I. This means that the consumption increases with the income. Consider a consumption function given as:
C = 50 + 0.8Y ……………… (1)
The consumption function can be shown with the help of the following schedule and diagram:
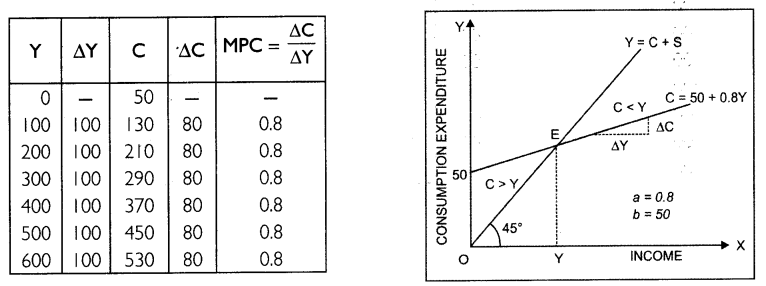
In the diagram, the horizontal axis represents income and vertical axis represents consumption expenditure. When income is zero, consumption is ₹ 50. This part of consumption is an autonomous consumption. As the level of income increases, the consumption also increases. The slope of the consumption curve or MPC or b is 0.8.
Question 3.
Explain ‘saving function’ with the help of a schedule and diagram.
Answer:
The relationship between saving and income is called the saving function. The following identity expresses the relationship between saving (S) and income (Y).
Y ≡ C + S
On S = Y – C … (1)
The consumption function is represented as:
C = a + bY … (2)
Substituting (2) in (1); we get
S = Y – (a + bY)
S = Y – a – bY S = -a + ( 1 – bY)
S = Saving
a = Amount of saving when level of income is zero.
(1 – b) = Slope of the saving function
Assume the consumption function is given as:
C= 100 + 0.8Y
Thus, the saving function becomes:
Note: The sum of Marginal Propensity to Consume and Marginal Propensity to Save is 1. That is,
MPC + MPS = 1
The saving function can be explained with the help of the following schedule and diagram
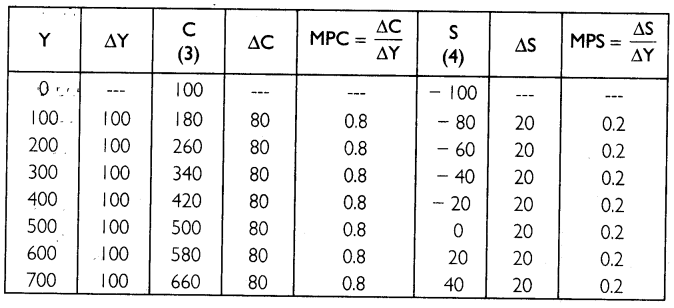
The diagrammatic presentation of saving function is given below.
In the diagram, the horizontal axis represents income and vertical axis represents consumption expenditure and saving. The straight line curves, C and S represent the consumption and saving function respectively. At ₹ 500, income is equal to consumption and savings are zero.
Question 4.
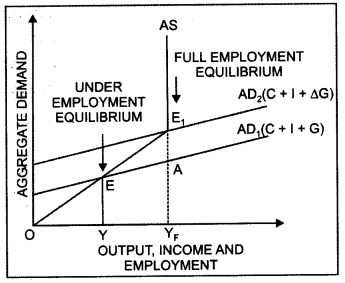
Explain the concept of underemployment equilibrium with the help of a diagram. Show on the same diagram the additional investment expenditure required to reach full employment equilibrium.
Answer:
Underemployment equilibrium is a state of equilibrium where not all resources are fully employed, that is, some resources are underemployed. The idea of underemployment equilibrium is explained in the Keynesian approach. The Keynesian approach was developed against the background of the great depression of 1930s.
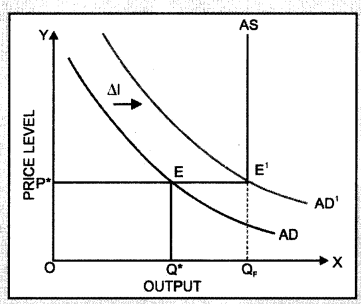
When there is deficient demand, actual Aggregate Demand is less than the full employment level of output. It is the situation of underemployment equilibrium. The concept of underemployment equilibrium can be explained with the help of following diagram:
In this diagram, AD is the Aggregate Demand curve and AS is the Aggregate Supply curve. OP* is the equilibrium price level, OQ* is the equilibrium level of output and OQF is the full employment level of output
Equilibrium is attained at the point of intersection of the Aggregate Demand curve and Aggregate Supply curve. It is an underemployment equilibrium because the equilibrium level of output is less than full employment level of output (OQ* < OQF).
In order to overcome the problem of underemployment equilibrium, the additional investment expenditure is required. Aggregate Demand curve will shift from AD to AD, by an amount of additional investment expenditure (∆l). The new point of intersection is E1, which is the full employment level of output. Thus, the Keynesian remedy to underemployment equilibrium places emphasis on increasing the level of Aggregate Demand by increasing investment expenditure.
Question 5.
Explain determination of national income using AD and AS approach. Use diagram to explain the changes that take place when AD is greater than AS. (CBSE 2014)
Answer:
The equilibrium is determined at the level of income where Aggregate Demand or planned expenditure is equal to the level of output in the economy. That is,
Y = AD
We know that, AD = C + I
Thus, Y = C + I
The determination of the equilibrium level of income can be represented with the help of Consumption + Investment (C + I) curve in the following diagram.
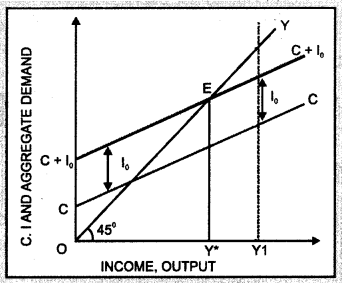
In the diagram, CC is the consumption function showing the desired level of consumption corresponding to each level of income. The desired investment curve, which is at fixed level l0, is added to the consumption function.
Thus, the level of total desired spending or Aggregate Demand is represented by C +10 curve. At each level of income, the C + l0 curve lies above the CC curve by an amount equal to lQ. The 45° line will enable us to identify the equilibrium level of income.
The economy is in equilibrium at the level of income where the C + l0 curve intersects the 45° line. Thus, the economy is in equilibrium at point E. Here, the level of desired spending on consumption and investment is exactly equal to the level of total output. The equilibrium level of output or income corresponding to point E is OY*.
When the Aggregate Demand in the economy exceeds the Aggregate Supply, there is a situation of excess demand in the economy. Thus, producers will decrease inventory and output would expand until equilibrium is attained.
Question 6.
Explain the equilibrium level of income with the help of saving and investment curves. If savings exceed planned investment, what changes will bring about the equality between them?
Or
Explain determination of national income using saving and investment approach. Use diagram explain the changes that take place when saving is greater than investment.
Answer:
The equilibrium is determined at the level of income where Aggregate Demand is equal to the Aggregate Supply. That is,
AD = AS … (1)
We know that, AD = C +1 …(2)
AS = C + S … (3)
By substituting (2) and (3) in (1), we get;
C + I = C + S
On I = S
Thus, the equilibrium level of income and output is attained when planned saving (S) and planned investment (I) are equal. The determination of equilibrium level of income using saving investment approach can be explained with the help of a diagram.
In the diagram, SS is the saving curve that shows planned saving at different levels of income. II is the investment curve that shows investment as given and constant. Planned saving and investment are equal (S = I) at point E. Corresponding to this point, OY* is the equilibrium level of income and output.
At OY, level of output, planned saving is saving is greater than planned investment (S > I). There is a situation of deficient demand in the economy. Thus, producers will increase inventory and output would contract until equilibrium is attained.
Question 7.
Explain the meaning of underemployment equilibrium. Explain two measures by which full employment equilibrium can be reached. (C.B.S.E Outside Delhi 2013)
Answer:
Equilibrium is attained when planned expenditure is equal to the planned output in the economy. If this equality is achieved at a level less than full employment level of output then the economy will be in a situation of underemployment equilibrium.
The two policy measures that the government can take are:
(i) Increase in Public Expenditure: Government can correct the situation of underemployment by increasing public expenditure on goods and services such as transportation, dams, electricity industry development expenditure, education, health etc. This increases the purchasing power of the public, which in turn, increases the demand for goods and corrects deficient demand. Moreover, increase in public expenditure also helps in eradicating poverty.
(ii) Open Market Operations: Open market operation is the policy of the central monetary authority to sell and buy the government securities in the market. The central bank purchases government securities from commercial banks and general public in a bid to correct thi# situation of deficient demand. This increases the stock of high powered money in the economy. As a result, the purchasing .power of the people increases, which increases the Aggregate Demand in the economy.
Question 8.
Define investment. Explain national income equilibrium through saving and investment function. Also explain the changes that take place in an economy when the economy is not in equilibrium. (C.B.S.E Outside Delhi 2014)
Answer:
Investment means addition to the stock of capital goods in the nature of structures, equipment or inventory. The equilibrium is determined at the level of income where Aggregate Demand is equal to the Aggregate Supply. That is,
AD = AS ……………. (1)
We know that, AD = C + 1 …(2)
AS = C + S …(3)
By substituting (2) and (3) in (1), we get;
C + I = C + S
On I = S
Thus, the equilibrium level of income and output is attained when planned saving (S) and planned investment (I) are equal. The determination of equilibrium level of income using saving-investment approach can be explained with the help of a schedule.
Question 9.
Explain the relationship between multiplier and MPC.
Answer:
Investment multiplier (K) is the relationship between the final change in income and the initial change in investment. It is estimated as the ratio of change in investment income due to change investment. Marginal Propensity to Consume (MPC) is the ratio of change in consumption to the change in income. There is a direct relationship between investment multiplier and MPC.
We know that,
One man’s expenditure is another man’s income. Whenever there is an increment in investment ex¬penditure, some individuals’ income is increased by the amount of investment with which they buy goods and services. They spend a part of their increased income on consumption and keep some income for saving. The individuals’ MPC determines the amount they spend or save. If MPC is greater than MPS, individuals will spend more on consumption; and if MPC is less than MPS, the individuals’ expenditure on consumption will be less.The extent of the effect of multiplier depends upon the Marginal Propensity to consume. Higher the MPC, higher will be the value of multiplier.
At lower MPC, multiplier is 2 and at higher MPC, multiplier is 4.
Question 10.
Assuming that increase in investment is ₹ 1,000 crore and MPC is 0.9. Explain the working of multiplier. (C.B.S.E. 2017)
Answer:
There is a direct relationship between investment multiplier and Marginal Propensity to Consume (MPC). The extent of the effect of multiplier depends upon MPC. Higher the MPC, higher will be the value of multiplier. The relationship between investment multiplier and MPC can be expressed with the help of the following equation:
\(K=\frac{1}{1-M P C}\)
Since the value of MPC lies between 0 and I (0 < MPC < I), the value of multiplier will always be greater than one.
Given that the MPC is 0.9. Further, there is an increase in investment worth ₹ 1,000 crores. Since the MPC is 0.9 the new consumption of goods will be 900 (0.9 * 1,000). The producers of those consumption goods will, thus, have an increase of ₹ 900 in their incomes.
Since their MPC is also 0.9, they will, in turn, spend ₹ 810 (0.9 * ₹ 900). This will cause an increase in the income of other people by ₹ 810. This process will go on. An endless chain of the secondary consumption spending is set in motion by the primary investment of ₹ 1,000 crores.
The total increase in consumption and investment spending, and therefore, the total increase in income can be calculated as:
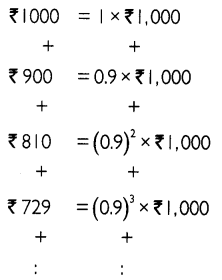
To determine the total increase in output of the final goods and services, we add up the infinite geometric series as:
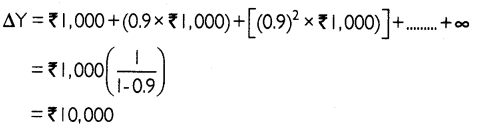
Thus, an increase in investment worth ₹ 1,000 crores, increases the income by ₹ 10,000 crores. That is, a change in investment has caused 10 times increase in income (output). Thus, the value of investment multiplier is 10.
Question 11.
Explain monetary measures for correcting inflationary and deflationary gap.
Answer:
Following are the monetary measures for correcting inflationary and deflationary gap:
Open Market Operation: Open .mirfeet perish: is- the policy of the central monetary authority to sell and buy; The government securities in.the market. RBI purchases or sells government securities to the general public in a bid to correct deficient or excess demand in the economy.
Bank Rate Policy: Bank rate is the minimum rate at which the central bank discounts the first class bills of exchange and provides credit to the commercial banks. Higher bank rate reduces the lending capacity of the commercial banks as they get funds at a higher interest rate from RBI.
Consequently, credit contracts in the economy as public borrows less at high rate of interest. It reduces excess demand. Similarly, lower bank rate increases the lending capacity of the commercial banks as they get funds at a lower interest rate from RBI. Consequently, credit expands in the economy as public borrows more at low rate of interest. It solves the problem of deficient demand.
Varying Reserve Requirements: Cash Reserve Ratio (CRR) is the minimum fraction of the total deposits with the commercial banks, which they are required to keep with the central bank Statutory Liquidity Ratio (SLR), on the other hand, is the minimum fraction of the total deposits with the commercial bank, which they are required to maintain in the form of specified liquid assets. A high (low) value of CRR or SLR helps increase (decrease) the value of reserve deposit ratio, thus diminishing (increasing) the value of the money multiplier and money supply in the economy.
Rationing of the Credit: Rationing of the credit implies controlling the quantity in the form of loan. Here, amount of loan is determined for speculative purpose. Hence, total demand can be increased by rationing of credit. It will increase the purchasing power of people and hence, deficient demand will be corrected. Rationing of credit should be increased by central bank for correcting the excess demand or inflationary gap. ,
Question 12.
Explain the role of the following in correcting the inflationary gap in an economy.
(i) Legal reserves
(ii) Bank rate (B.S.E Outside Delhi 2011)
Answer:
The problem of excess demand or inflationary gap can be corrected by adopting following monetary measures:
(i) Legal Reserve or Cash Reserve Ratio: Legal reserves or Cash Reserve Ratio (CRR) is the minimum fraction of the total deposits with the commercial banks, which they are required to keep with the central bank, The central bank increases the CRR to correct the situation of excess demand or inflationary gap in the economy. High CRR reduces the supply of money in the economy, and thus, the Aggregate Demand will fall.
(ii) Bank Rate: Bank rate is the minimum rate at which the central bank discounts the first class bills of exchange and provides credit to the commercial banks. The central bank increases the bank rate to correct the situation of excess demand in the economy. Higher bank rate reduces the lending capacity of the commercial banks as they get funds at a higher interest rate from the central bank. Consequently, money supply contracts in the economy as the public borrows less at high rate of interest and Aggregate Demand falls.
Question 13.
Explain the role of the following in correcting the deflationary gap in an economy:
(i) Open market operations
(ii) Margin requirements (C.B.S.E. Outside Delhi 2011)
Answer:
The problem of deficient demand or deflationary gap can be corrected by adopting following monetary measures:
(i) Open Market Operations: Open market operation is the policy of the central monetary authority to sell and buy the government securities in the market. The central bank purchases government securities from commercial banks and general public in a bid to correct the situation of deficient demand. This increases the stock of high powered money in the economy. As a result, the purchasing power of the people increases, which increases the Aggregate Demand in the economy.
(ii) Margin Requirement: Margin requirement of loan is the minimum security price charged by the commercial bank for granting loans. A decrease in margin requirement will correct the situation of deficient demand in the economy. Lower margin requirement implies lower security price for a loan. Thus, people will borrow more loans from the banks and the Aggregate Demand will increase.
Question 14.
Explain the concept of inflationary gap. Explain the role of Repo Rate in reducing this gap.
Answer:
Inflationary gap refers to the excess of anticipated expenditure over the available supply of output at constant prices of base period. It is also known as excess demand. It measures the gap between AD and AS at full employment level of output.
Since Aggregate Demand remains more than essential demand at full employment level, there is a significant increment in monetary income. Thus, there is an over employment equilibrium. This increases the Aggregate Demand but production cannot be increased as Aggregate Supply is perfectly inelastic. The problem of excess demand can be explained with the help of a diagram
In the diagram, point E represents the state of over employment equilibrium in the economy. At E, the gap between Aggregate Demand and Aggregate Supply is AEr That is, AE, is the excess demand. The problem of excess demand can be corrected only by the interference of the government (increasing taxes and reducing public expenditure).
Repo rate refers to the rate at which central bank lends short term funds to commercial banks as the lender of last resort. The central bank increases the repo rate to correct the situation of excess demand.
Higher repo rate increases the cost of borrowings by the commercial banks, which thereby reduces their lending capacity. Consequently, money supply contracts in the economy as the public borrows less at high rate of interest and hence, Aggregate Demand falls.
Question 15.
Explain the concept of inflationary gap. Explain the role of ‘Open Market Operations’ in reducing this gap. (C.B.S.E. 2015)
Answer:
Deflationary gap refers to the excess of available supply of output (Aggregate Supply) over the anticipated expenditure (Aggregate Demand) at constant prices of base period. It measures the gap between AD and AS at full employment level of output. Since Aggregate Demand remains less than essential demand at full employment level, the problem of involuntary unemployment takes place. Thus, there is an under employment equilibrium.
The problem of deficit demand can be explained with the help of a diagram. In the diagram, point E represents the state of under employment equilibrium in the economy. At E, AD = AS but QY, level of unemployment prevails in the economy. At full employment level of output (OYF), the gap between Aggregate Demand and Aggregate Supply is AEr That is, AE, is the deficit demand or deflationary gap. The problem of deficit demand can be corrected only by the interference of the government using measures such as decreasing taxes or increasing public expenditure.
Open market operation is the policy of the central monetary authority to sell and buy the government securities in the market. The central bank purchases government securities from commercial banks and general public in a bid to correct the situation of deficient demand. This increases the stock of high powered money in the economy. As a result, the purchasing power of the people increases, which increases the Aggregate Demand in the economy.
How can deficient and excess demand be corrected through changes in public expenditure? Deficient and excess demand can be corrected by changing public expenditure.
(i) Increase in Public Expenditure: Government can correct the situation of deficient demand by increasing public expenditure on goods and services such as transportation, dams, electricity industry development expenditure, education, health etc. This increases the purchasing power of the public which, in turn, increases the demand for goods and corrects deficient demand.
Moreover, increase in public expenditure also helps in eradicating poverty. According to Lord Kenyes, increase in the public expenditure is the best measure for correcting deficient demand. The effect of increase in public expenditure can be explained with the help of a diagram. In the diagram, horizontal axis shows the output and vertical axis shows the Aggregate Demand. The initial Aggregate Demand curve (AD,) is an upward sloping line comprising of private
consumption (C), investment expenditure (I) and government expenditure (G,). Aggregate Supply (AS) is a vertical line at the full employment level of output (YF). With the initial government expenditure of G,; the Aggregate Demand is OY while Aggregate Supply is OYF There is a situation of deficient demand as AD < AS. As government expenditure is increased to G2, AD curve shifts up to AD, until equilibrium is attained (AD = AS) at fuil employment level of output Thus, the problem of deficient demand or deflationary gap can be corrected by increasing public expenditure.
Decrease in Public Expenditure: Government can correct the situation of excess demand by decreasing public expenditure on goods and services such as transportation, dams, electricity industry development expenditure, education, health etc. This decreases the purchasing power of the public which, in turn, decreases the demand for goods and corrects excess demand. The effect of decrease in public expenditure can be explained with the help of a diagram.
With the initial government expenditure of G,; the Aggregate Demand is OY while Aggregate Supply is OYF. There is a situation of excess demand as AD > AS. As government expenditure is decreased to G2, AD curve shifts down to AD, until equilibrium is attained (AD = AS) at full employment level of output. Thus, the problem of excess demand or inflationary gap can be corrected by decreasing public expenditure.
Question 16.
Explain the meaning of underemployment equilibrium. Explain two measures by which full employment equilibrium can be reached. (C.B.S.E Outside Delhi 2013)
Answer:
Equilibrium is attained when planned expenditure is equal to the planned output in the economy. If this equality is achieved at a level less than full employment level of output then the economy will be in a situation of under employment equilibrium.
The two policy measures that the government can take are:
(i) Increase in Public Expenditure: Government can correct the situation of underemployment by increasing public expenditure on goods and services such as transportation, dams, electricity industry development expenditure, education, health etc. This increases the purchasing power of the public which, in turn, increases the demand for goods and corrects deficient demand. Moreover, increase in public expenditure also helps in eradicating poverty.
(ii) Open Market Operations: Open market operation is the policy of the central monetary authority to sell and buy government securities in the market. The central bank purchases government securities from commercial banks and general public in a bid to correct the situation of deficient demand. This increases the stock of high powered money in the economy. As a result, the purchasing power of the people increases, which increases the Aggregate Demand in the economy.
Question 17.
What is meant by inflationary gap? State three measures to reduce this gap. (C.B.S.E 2018)
Answer:
Inflationary gap refers to the excess of anticipated expenditure over the available supply of output at constant prices of base period. It is also known as excess demand.
Following are the three measures that can be used to correct the problem of inflationary gap:
(i) Increasing Bank Rate: Bank rate is the minimum rate at which the central bank discounts the first class bills of exchange and provides credit to the commercial banks. The central bank increases the bank rate to correct the situation of inflationary gap or excess demand in the economy.
Higher bank rate reduces the lending capacity of the commercial banks as they get funds at a higher interest rate from the central bank. Consequently, money supply contracts in the economy as the public borrows less at high rate of interest and Aggregate Demand falls.
(ii) Selling Government securities: Open market operation is the policy of the central monetary authority to sell and buy the government securities in the market. The central bank sells government securities to commercial banks and general public in a bid to correct the situation of inflationary gap or excess demand. This decreases the stock of high powered money in the economy. As a result, the purchasing power of the people declines, which decreases the Aggregate Demand in the economy.
(iii) Decrease in Public Expenditure: Government can correct the situation of excess demand by decreasing public expenditure on goods and services such as transportation, dams, electricity industry development expenditure, education, health etc. This decreases the purchasing power of the public which, in turn, decreases the demand for goods and corrects excess demand.
Determination of Income and Employment Important Extra Questions HOTS
Question 1.
Calculate C when \(\bar{C}\)= 200, MPC = 0.5 and income (Y) = 1,000
Answer:
The consumption function is given as:
C = \(\bar{C}\)+ cY ……………. (1)
where; c = MPC
Substituting appropriate values in (1) , we get:
C = 200 + (0.5 x 1,000) = 200 + 500 = 700
Thus, the total consumption expenditure is 700.
Question 2.
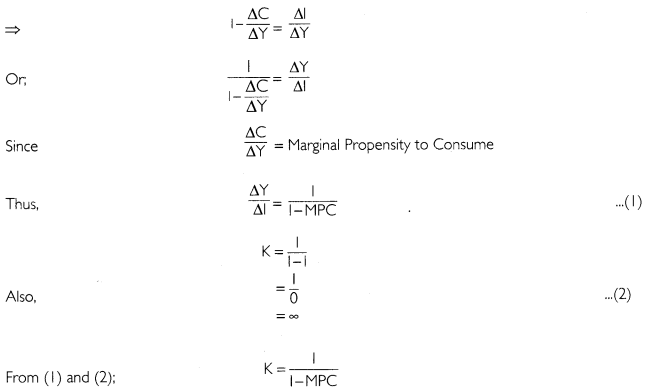
How do we find that \(K=\frac{3}{1-M P C} ?\)
Answer:
Question 3.
Given consumption function C = 100 + 0.75Y (where C = consumption expenditure and y = National Income and investment expenditure ₹ 1000. Calculate:
(i) Equilibrium level of National Income
(ii) Consumption expenditure at equilibrium level of National Income
Answer:
(i) The consumption function and investment are given as
C = 100 + 0.75Y …(1)
I = 1,000 …(2)
Equilibrium level of National Income is determined as:
Y = C + 1 … (3)
Substituting appropriate values in (3); we get
Y= 100 + 0.75Y + 1000 Y – 0.75Y
= 1,100 0.25 Y = 1,100
= 4,400
Thus, the equilibrium level of National Income is ₹ 4,400.
(ii) Substituting Y = 4400 in (1); we get
C= 100 + 0.75(4,400)
= 100 + 3,300 = 3,400
Thus, the consumption expenditure at equilibrium level of National Income is ₹ 3,400.