RD Sharma Class 10 Solutions Chapter 15 Statistics Ex 15.3
These Solutions are part of RD Sharma Class 10 Solutions. Here we have given RD Sharma Class 10 Solutions Chapter 15 Statistics Ex 15.3
Other Exercises
- RD Sharma Class 10 Solutions Chapter 15 Statistics Ex 15.1
- RD Sharma Class 10 Solutions Chapter 15 Statistics Ex 15.2
- RD Sharma Class 10 Solutions Chapter 15 Statistics Ex 15.3
- RD Sharma Class 10 Solutions Chapter 15 Statistics Ex 15.4
- RD Sharma Class 10 Solutions Chapter 15 Statistics Ex 15.5
- RD Sharma Class 10 Solutions Chapter 15 Statistics Ex 15.6
- RD Sharma Class 10 Solutions Chapter 15 Statistics Ex VSAQS
- RD Sharma Class 10 Solutions Chapter 15 Statistics MCQS
Question 1.
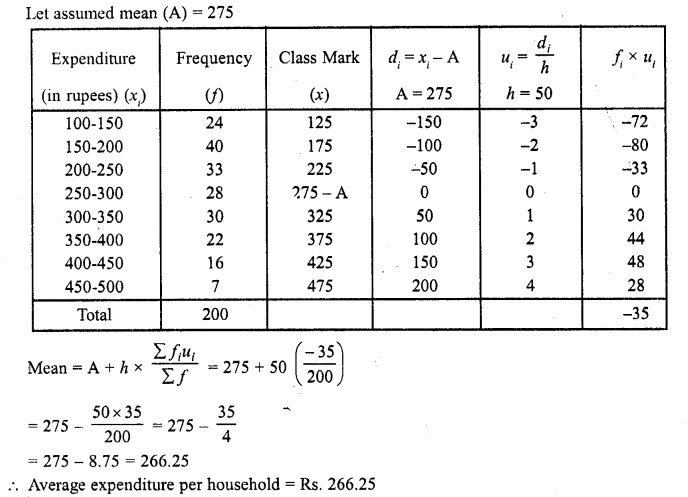
The following table gives the distribution of total household expenditure (in rupees) of manual workers in a city.
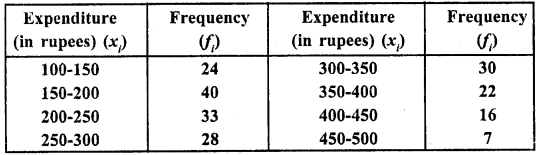
Find the average expenditure ( in rupees ) per household.
Solution:
Question 2.
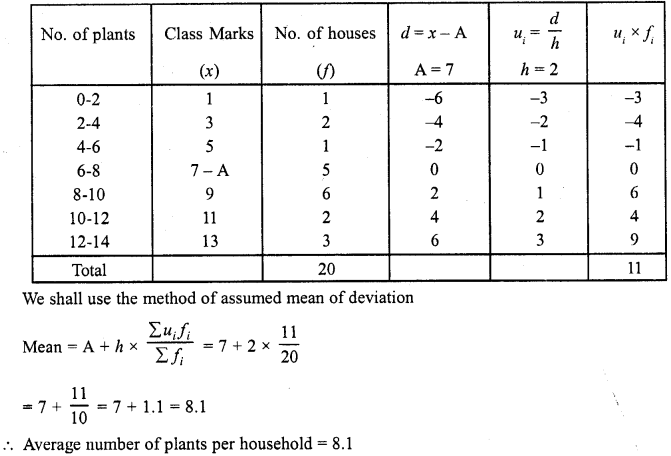
A survey was conducted by a group of students as a part of their environment awareness programme, in which they collected the following data regarding the number of plants in 20 houses in a locality. Find the mean number of plants per house.

Which method did you use for finding the mean, and why ?
Solution:
Let assumed mean (A) = 7
Question 3.
Consider the following distribution of daily wages of 50 workers of a facotry.
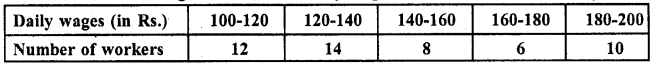
Find the mean daily wages of the workers of the factory by using an appropriate method.
Solution:
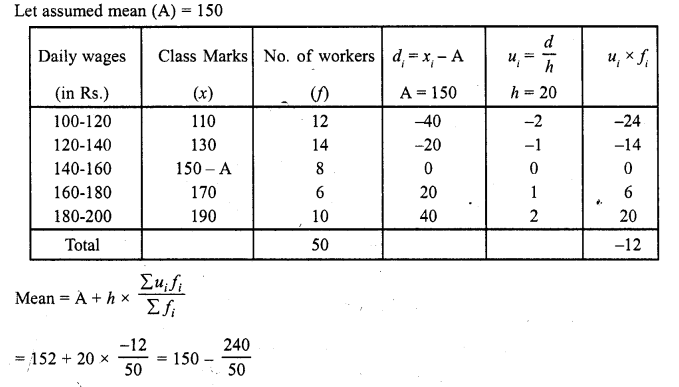
= 150 – 4.80 = 145.20
Mean daily wages per worker = Rs. 145.20
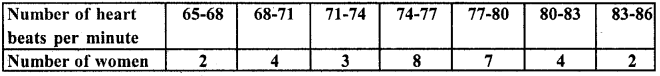
Question 4.
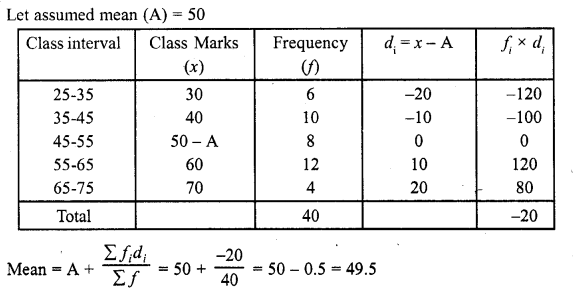
Thirty women were examined in a hospital by a doctor and the number of heart beats per minute recorded and summarised as follows. Find the mean heart beats per minute for these women, choosing a suitable method.
Find the mean of each of the following frequency distribution (5 – 14)
Solution:
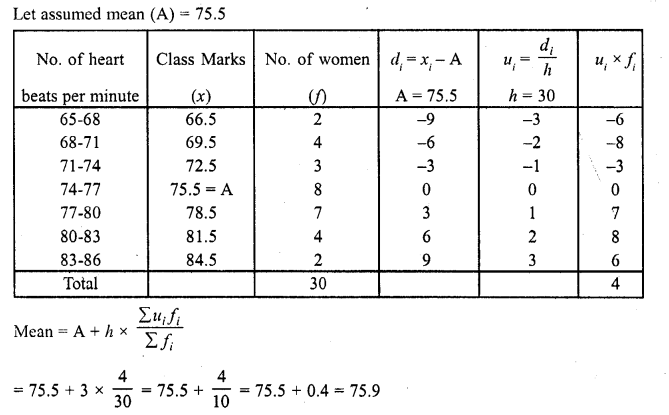
Hence heart beats per minute = 75.9
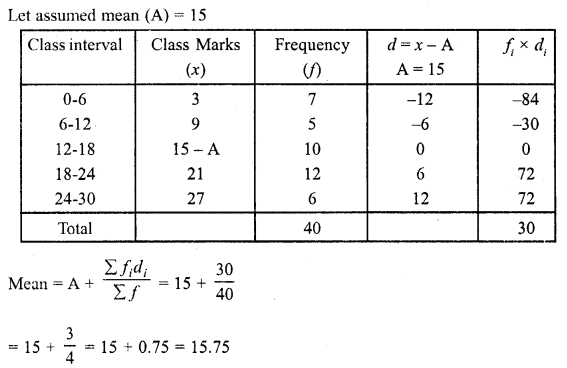
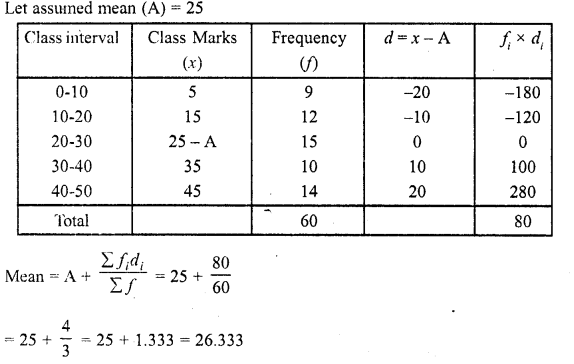
Question 5.
Find the mean of each the following frequency distributions : (5 – 14)

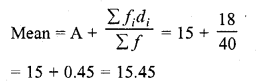
Solution:
Let Assumed mean (A) =15

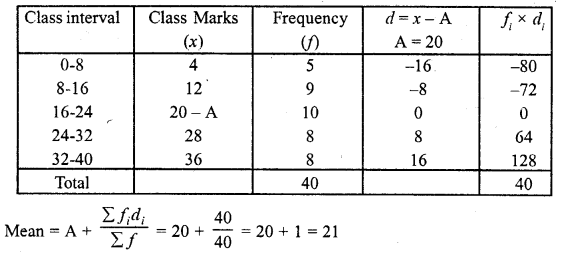
Question 6.
Solution:
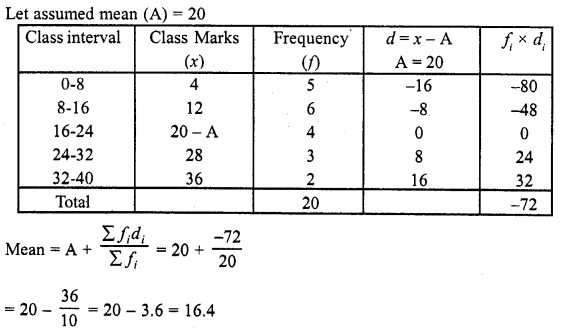
Question 7.

Solution:
Question 8.

Solution:
Question 9.

Solution:
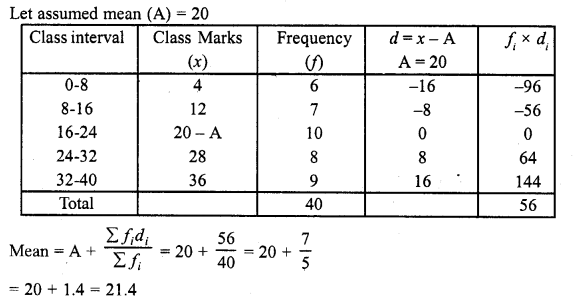
Question 10.

Solution:
Let assumed mean = 20
Question 11.

Solution:
Question 12.
Solution:
Question 13.

Solution:
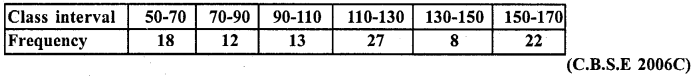
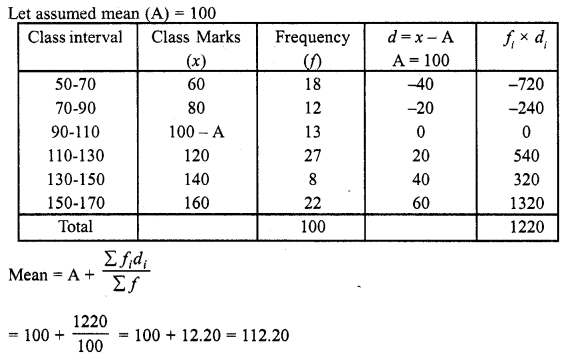
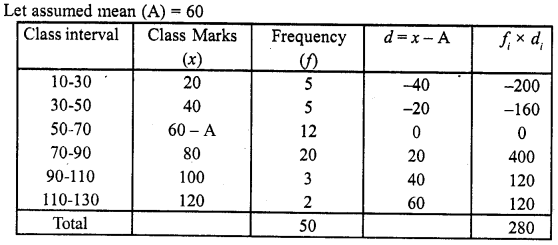
Question 14.
Solution:
![]()
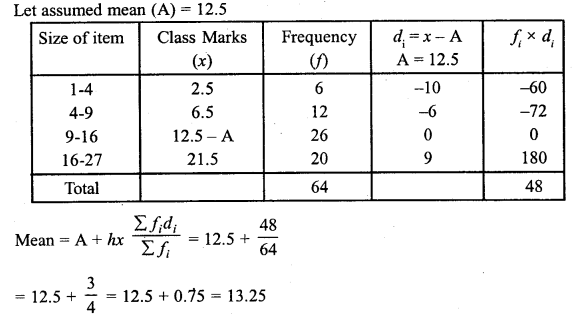
Question 15.
For the following distribution, calculate mean using all suitable methods.
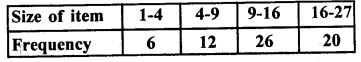
Solution:
Let assumed mean (A) = 12.5
Question 16.
The weekly observation on cost of living index in a certain city for the year 2004 – 2005 arc given below. Compute the weekly cost of living index.
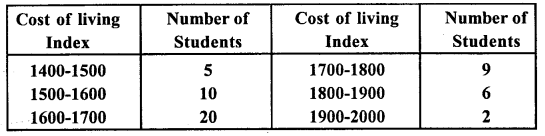
Solution:
Let assumed mean (A)= 1650
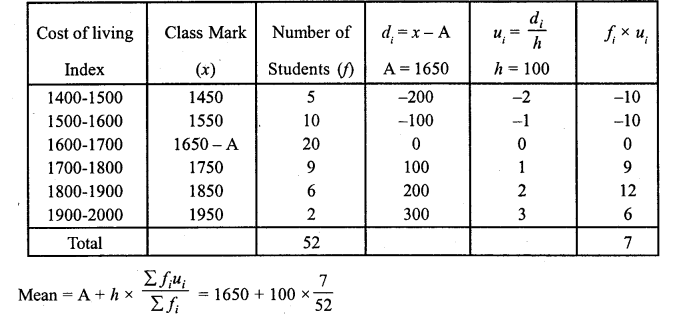
= 1650 + 13.46 = 1663.46
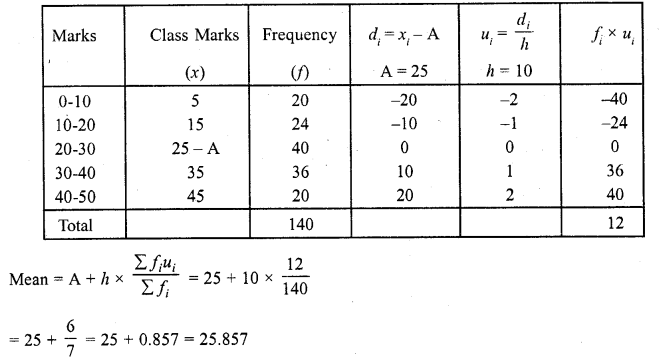
Question 17.
The following table shows the marks scored by 140 students in an examination of a certain paper:
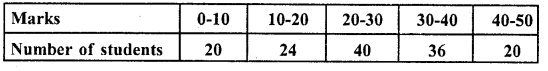
Calculate the average marks by using all the three methods: direct method, assumed mean deviation and shortcut method.
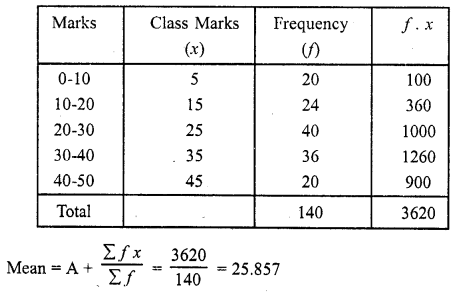
Solution:
(i) Direct Method :
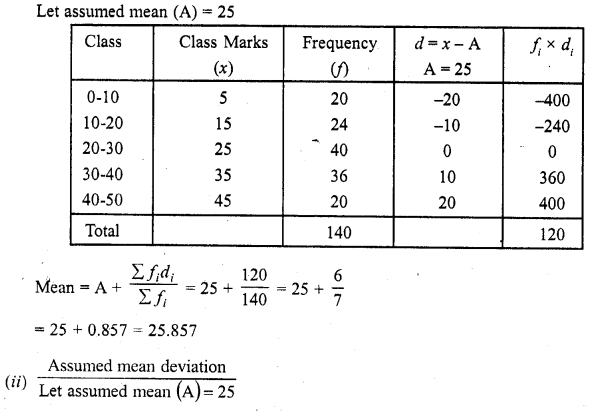
(ii) Shortcut Method:
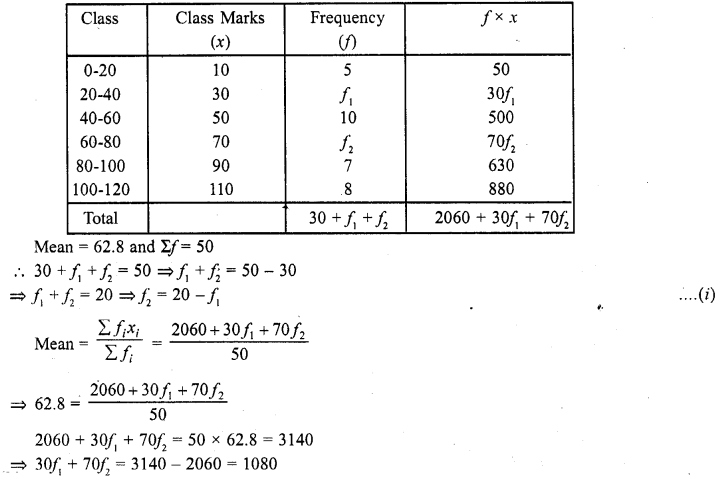
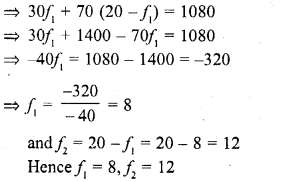
Question 18.
The mean of the following frequency distribution is 62.8 and the sum of all the frequencies is 50. Compute the missing frequency / and (C.B.S.E. 2004)

Solution:
Question 19.
The following distribution shows the daily pocket allowance given to the children of a multistory building. The average pocket allowance is Rs. 18.00. Find out the missing frequency.
Solution:
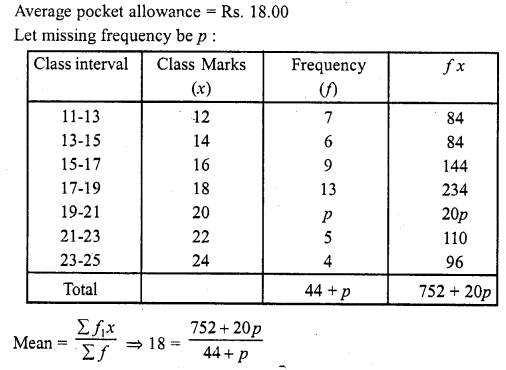
⇒ 752 + 20p = 792 + 18p
⇒ 20p- 18p = 792 – 752
⇒2p = 40
⇒p = \(\frac { 40 }{ 2 }\)
Hence missing frequency = 20
Question 20.
If the mean of the following distribution is 27, find the value of p.

Solution:
Mean = 27
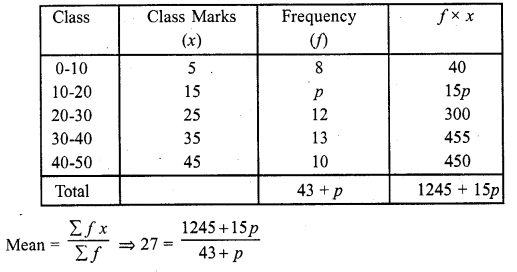
⇒ 27 (43 +p) = 1245 + 15p
⇒ 1161 + 21p = 1245 + 15p
⇒ 27p -15p= 1245 – 1161
⇒ 12p = 84
⇒ p = \(\frac { 84 }{ 12 }\)
Hence p = 1
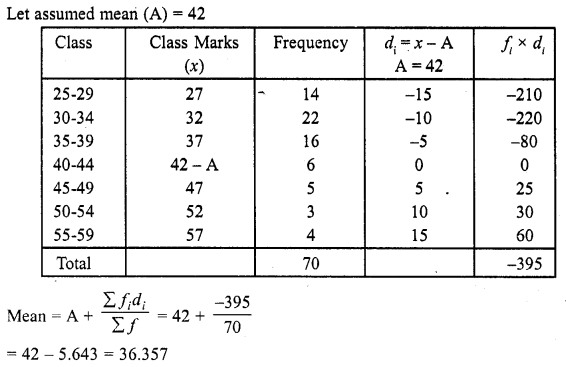
Question 21.
In a retail market, fruit vendors were selling mangoes kept in packing boxes. These boxes contained varying number of mangoes. The following was the distribution of mangoes according to the number of boxes.
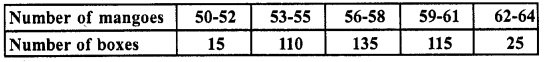
Find the mean number of mangoes kept in a packing box. Which method of finding the mean did you choose ?
Solution:
We shall apply the assumed mean deviation method
Let assumed mean (A) = 57
We shall choose the method of assumed mean deviation :
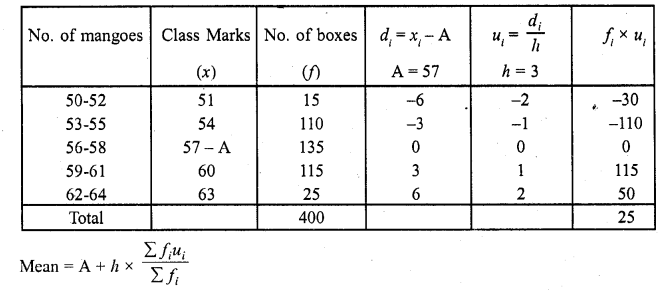
= 57 + 3 x \(\frac { 25 }{ 100 }\)
= 57 + \(\frac { 3 }{ 16 }\)
= 57 + 0.1875 = 57.1875 = 57.19
Question 22.
The table below shows the daily expenditure on food of 25 households in a locality

Solution:
Let assumed mean (A) = 225
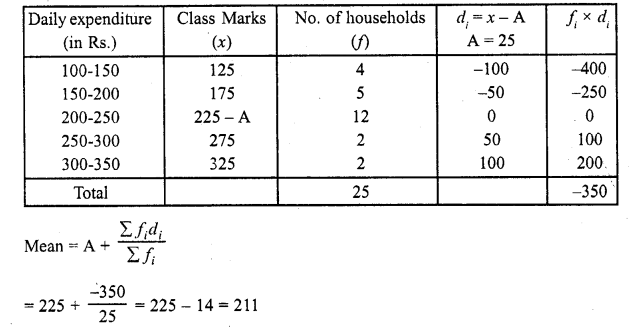
∴ Mean expenditure on food = Rs. 211
Question 23.
To find out the concentration of S02 in the air (in parts per million, i.e., ppm), the data was collected for 30 localities in a certain city and is presented below :
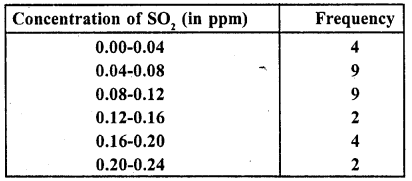
Find the mean concentration of S02 in the air.
Solution:
Let assumed mean (A) = 0.10
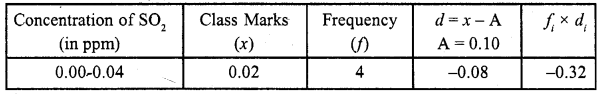
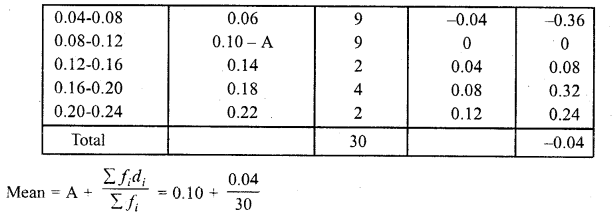
= 0.10 – 0.00133 = 0.09867 = 0.099 (approx)
Question 24.
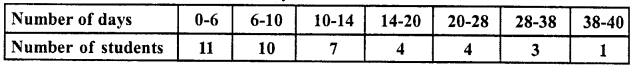
A class teacher has the following absentee record of 40 students of a class for the whole term. Find the mean number of days student was absent.
Solution:
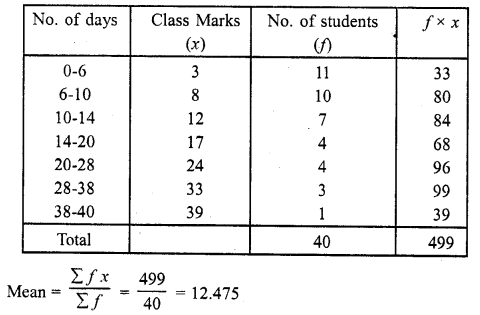
∴ Mean number of days a students was absent = 12.475
Question 25.
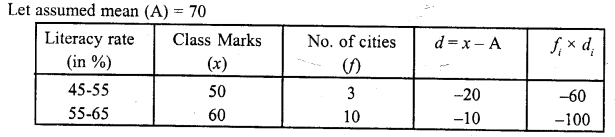
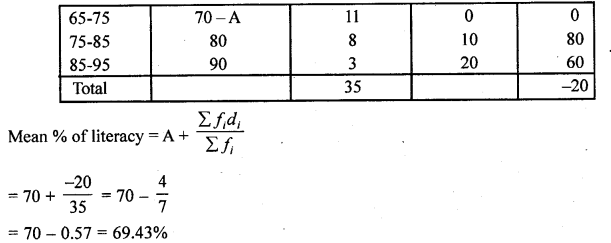
The following table gives the literacy rate (in percentage) of 3§ cities. Find the mean
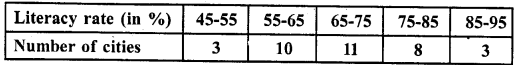
Solution:
Question 26.
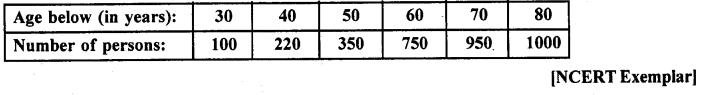
The following is the cummulative frequency distribution (of less than type) of 1000 persons each of age 20 years and above. Determine the mean age.[NCERT Exemplar]
Solution:
First, we make the frequency distribution of the given data and then proceed to calculate mean by computing class marks (xi), ui’s and fiui‘s as follows:
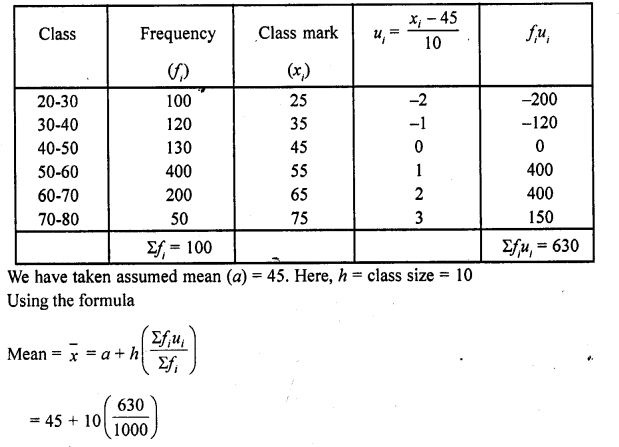
= 45 + 6.3 = 51.3
Thus, the mean age is 51.3 years.
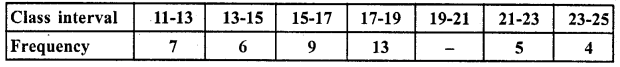
Question 27.
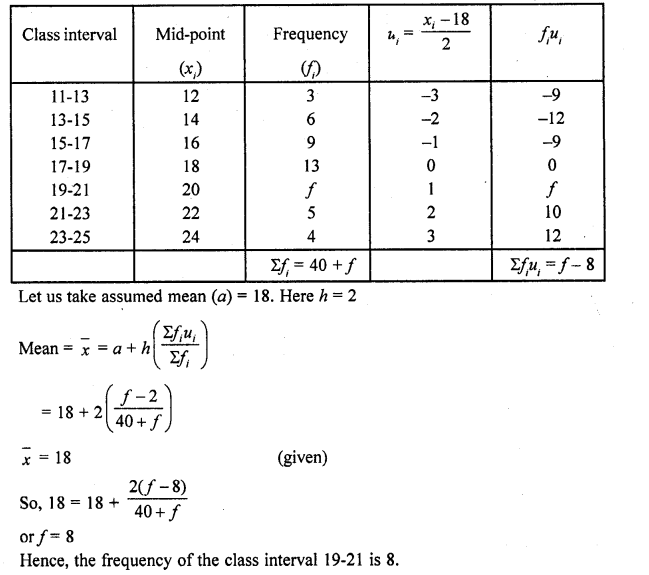
If the mean of the following frequency distribution is 18, find the missing frequency.
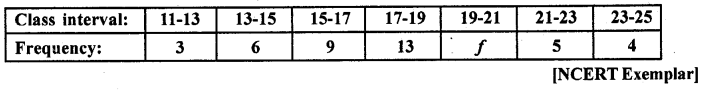
Solution:
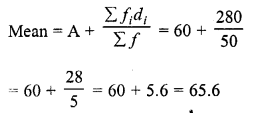
Question 28.
Find the missing frequencies in the following distribution, if the sum of the frequencies is 120 and the mean is 50.

Solution:
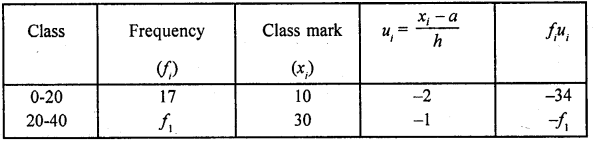
⇒ 4+ f2 -f1 = 0
⇒ -f2+ f1 = 4 ……..(ii)
On adding Eqs. (i) and (ii), we get
⇒ 2f1 = 56
⇒ f1= 28
Put the value of f1 in Eq. (i), we get
f2 = 52-28
⇒ f2 = 24
Hence, f1 = 28 and f2 = 24
Question 29.
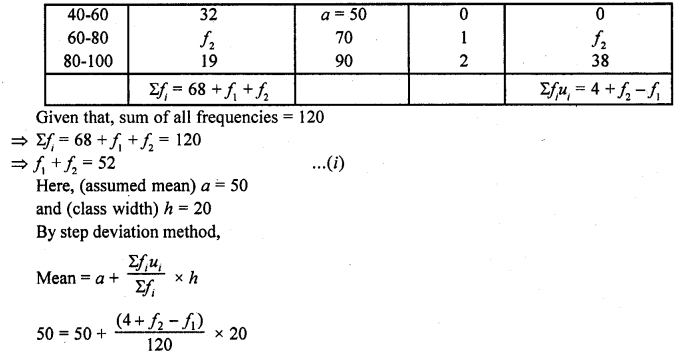
The daily income of a sample of 50 employees are tabulated as follows:
Find the mean daily income of employees. [NCERT Exemplar]
Solution:
Since, given data is not continuous, so we subtract 0.5 from the lower limit and add 0.5 in the upper limit of each class.
Now we first, find the class mark xt of each class and then proceed as follows:
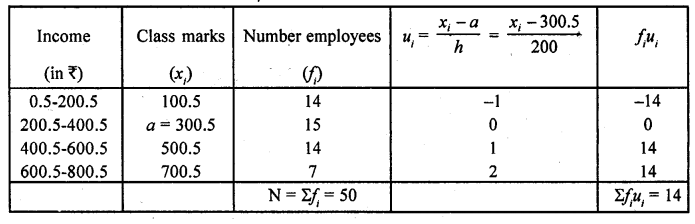
∴ Assumed mean, a = 300.5
Class width, h = 200
and total observation, N = 50
By step deviation method,
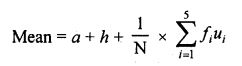
= 300.5 + 200 x \(\frac { 1 }{ 50 }\) x 14
= 300.5 + 56 = 356.5
Hope given RD Sharma Class 10 Solutions Chapter 15 Statistics Ex 15.3 are helpful to complete your math homework.
If you have any doubts, please comment below. Learn Insta try to provide online math tutoring for you.