RD Sharma Class 10 Solutions Chapter 15 Statistics Ex 15.5
These Solutions are part of RD Sharma Class 10 Solutions. Here we have given RD Sharma Class 10 Solutions Chapter 15 Statistics Ex 15.5
Other Exercises
- RD Sharma Class 10 Solutions Chapter 15 Statistics Ex 15.1
- RD Sharma Class 10 Solutions Chapter 15 Statistics Ex 15.2
- RD Sharma Class 10 Solutions Chapter 15 Statistics Ex 15.3
- RD Sharma Class 10 Solutions Chapter 15 Statistics Ex 15.4
- RD Sharma Class 10 Solutions Chapter 15 Statistics Ex 15.5
- RD Sharma Class 10 Solutions Chapter 15 Statistics Ex 15.6
- RD Sharma Class 10 Solutions Chapter 15 Statistics Ex VSAQS
- RD Sharma Class 10 Solutions Chapter 15 Statistics MCQS
Question 1.
Find the mode of the following data :
(i) 3, 5, 7, 4, 5, 3, 5, 6, 8, 9, 5, 3, 5, 3, 6, 9, 7, 4
(ii) 3, 3, 7, 4, 5, 3, 5, 6, 8, 9, 5, 3, 5, 3, 6, 9, 7, 4
(iii) 15, 8, 26, 25, 24, 15, 18, 20, 24, 15, 19, 15
Solution:
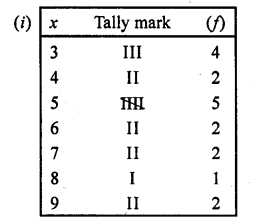
We see that 5 occurs in maximum times which is 5
∴ Mode = 5
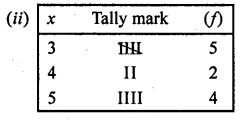
we see that 3 occurs in maximum times i.e. 5
∴ Mode = 3
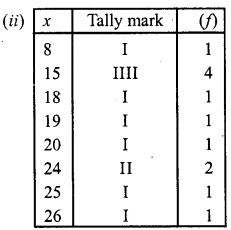
Here we see that 15 occurs in maximum times i.e. 54
∴ Mode = 15
Question 2.
The shirt sizes worn by a group of 200 persons, who bought the shirt from a store, are as follows :
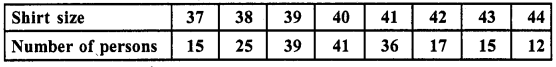
Find the model shirt size worn by the group.
Solution:
We see that frequency of 40 is maximum which is 41
∴Mode = 40
Question 3.
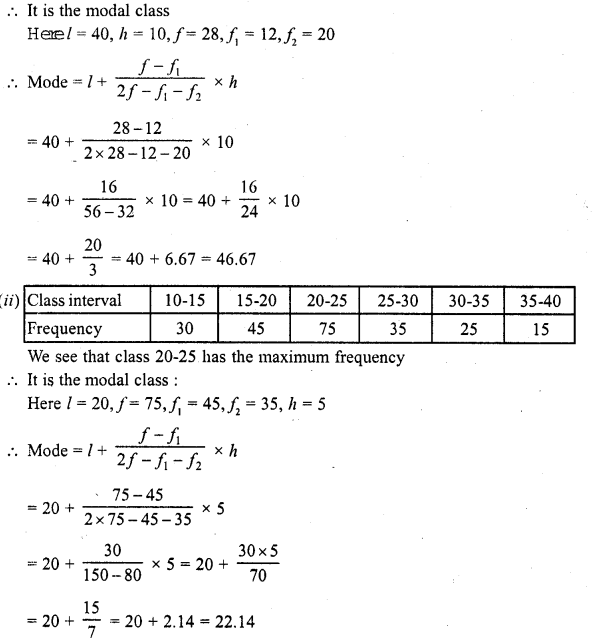
Find the mode of the following distribution.
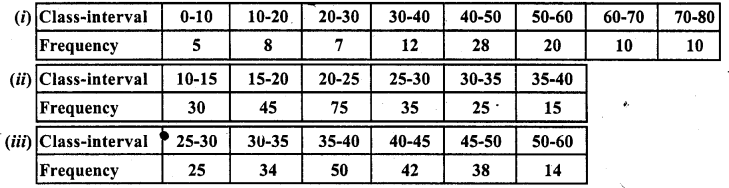
Solution:

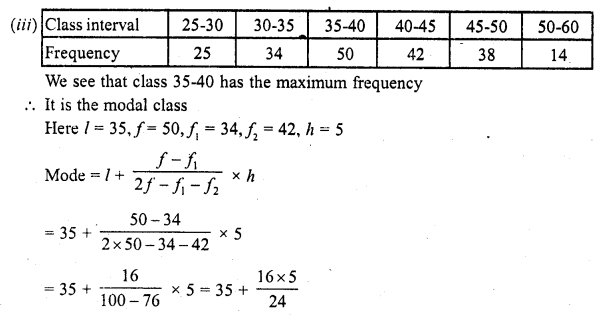
Question 4.
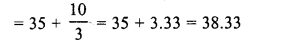
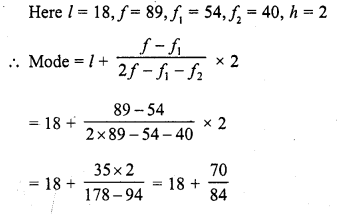
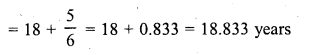
Compare the modal ages of two groups of students appearing for an entrance test :
Solution:
(i) For group A
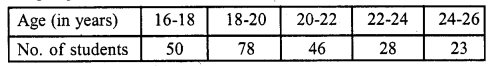
We see that class 18-20 has the maximum frequency
∴ It is a modal class
(ii) For group B
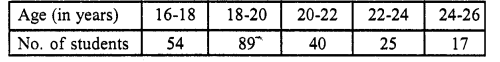
We see that class 18-20 has the maximum frequency
∴ It is a modal class
Question 5.
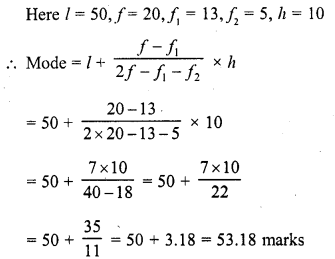
The marks in science of 80 students of class X are given below: Find the mode of the marks obtained by the students in science.

Solution:

We see that class 50-60 has the maximum frequency 20
∴ It is a modal class
Question 6.
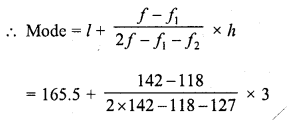
The following is the distribution of height of students of a certain class in a certain city :

Find the average height of maximum number of students.
Solution:
Writing the classes in exclusive form,

Here model class is 165.5 – 168.5
and l = 165.5, h = 3, f= 142, f1= 118, f2= 127
Question 7.
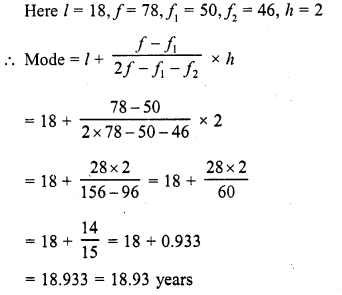
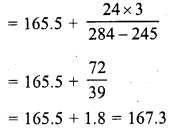
The following table shows the ages of the patients admitted in a hospital during a year :
Find the mode and the mean of the data given above. Compare and interpret the two measures of central tendency.
Solution:
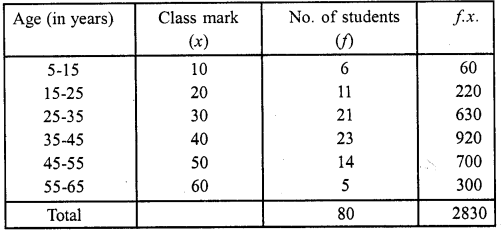
(i) We see that class 35-45 has the maximum frequency 23
∴ It is a modal class
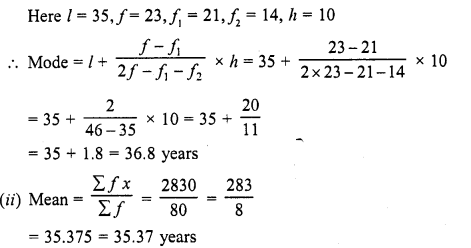
= 35.375 = 35.37 years
We see that mean is less than its mode
Question 8.
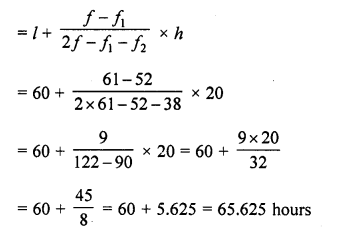
The following data gives the information on the observed lifetimes (in hours) of 225 electrical components :
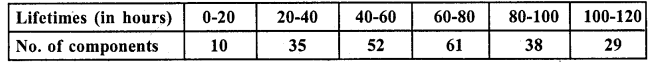
Determine the modal lifetimes of the components.
Solution:
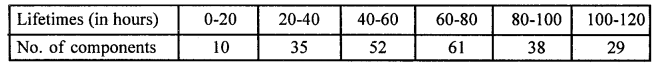
We see that class 60-80 has the maximum frequency 61
∴ It is the modal class
Here l = 60, f= 6, f1 = 52, f2 = 38,h = 20
∴ Modal of life time (in hrs.)
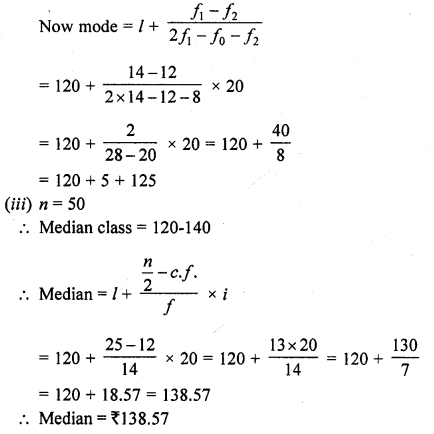
Question 9.
The following table gives the daily income of 50 workers of a factory :
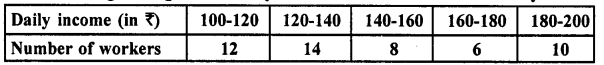
Find the mean, mode and median of the above data. (C.B.S.E. 2009)
Solution:
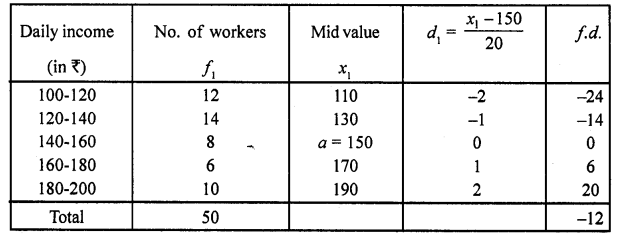
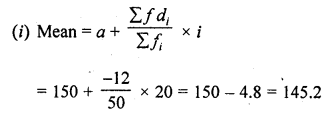
Here i = 20 and AM = 150
(ii) Max frequency = 14
∴ Model class = 120 – 140
Question 10.
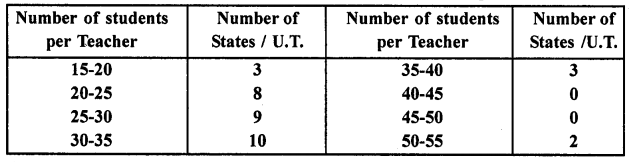
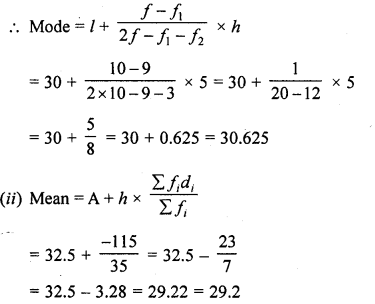
The following distribution gives the state-wise teacher-student ratio in higher secondary schools of India. Find the mode and mean of this data. Interpret, the two measures:
Solution:
Let assumed mean (A) = 32.5
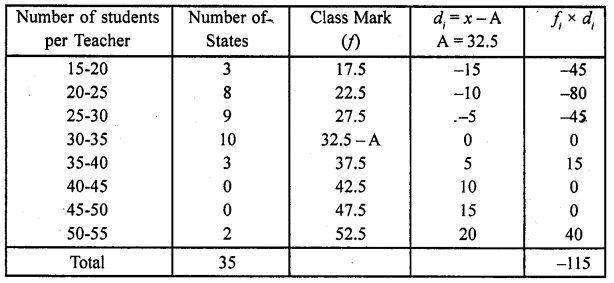
(i) We see that the class 30-35 has the maximum frequency
∴ It is the modal class
Here l = 30,f = 10, f1 = 9, f2 = 3, h = 5
Question 11.
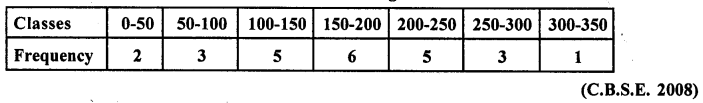
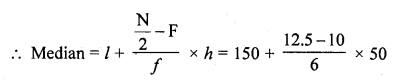
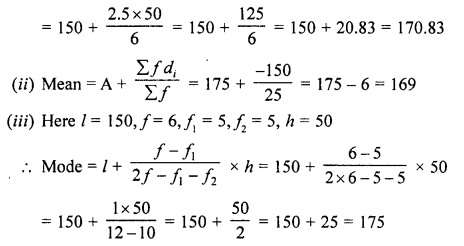
Find the mean, median and mode of the following data:
Solution:
Let assumed mean (A) =175
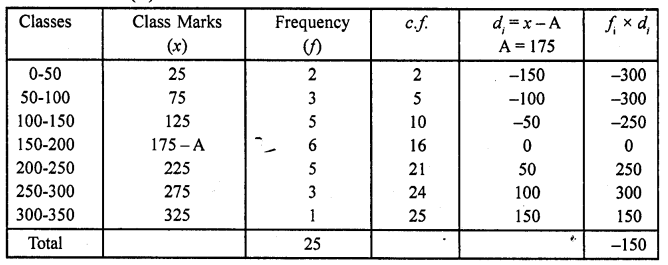
(i) Here N = 25, \(\frac { 5 }{ 3 }\) = \(\frac { 25 }{ 2 }\) = 12.5 or 13 which lies in the class 150-200
l= 150, F= 10, f= 6, h = 50
Question 12.
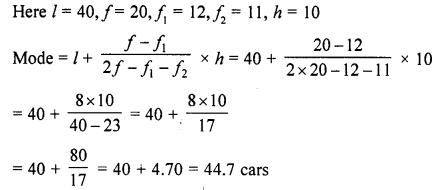
A student noted the number of cars passing through a spot on a road for 100 periods each of 3 minutes and summarised it in the table given below. Find the mode of the data.
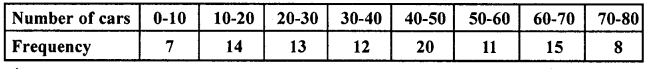
Solution:
We see that class 40-50 has the maximum frequency
∴ It is a modal class
Question 13.
The following frequency distribution gives the monthly consumption of electricity of 68 consumers of a locality. Find the median, mean and mode of the data and compare them:
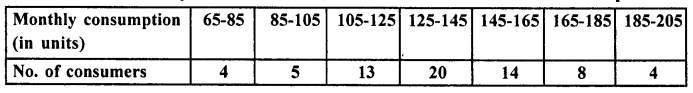
Solution:
Let assumed mean (A) = 135
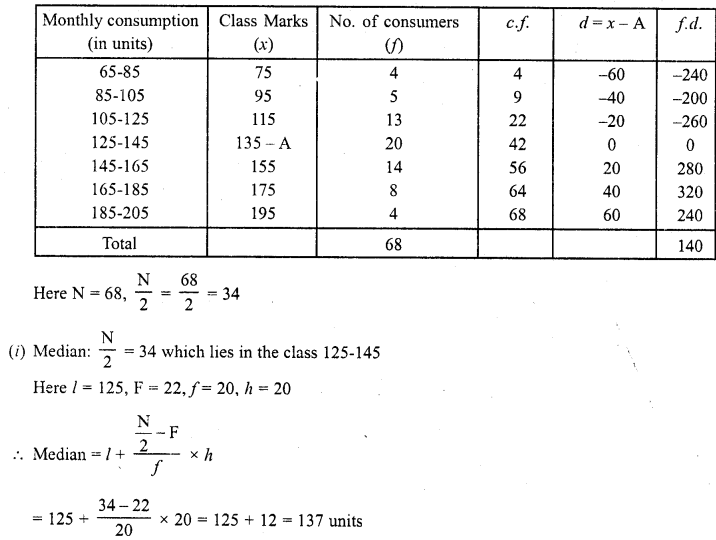
Here N = 68 , \(\frac { N }{ 2 }\) = \(\frac { 68 }{ 2 }\) = 34
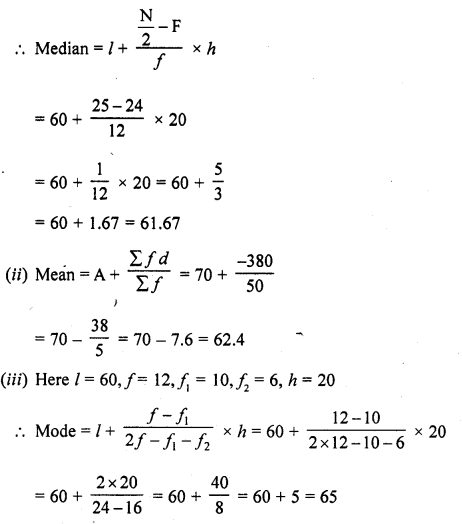
Question 14.
100 surnames were randomly picked up from a local telephone directory and the frequency distribution of the number of letters in the English alphabets in the surnames was obtained as follows:
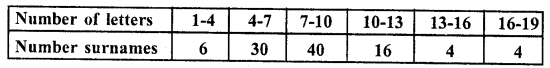
Determine the median number of letters in the surnames. Find the mean number of letters in the surnames. Also, And the modal size of the surnames.
Solution:
Let Assumed mean (A) = 8.5
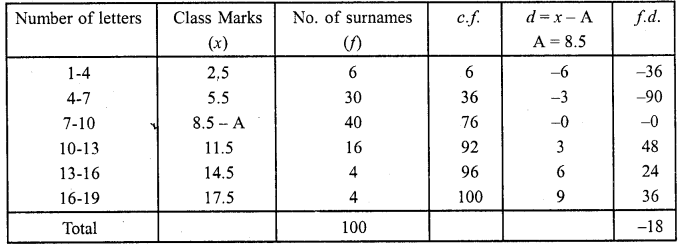
(i) Here N = 100, \(\frac { N }{ 2 }\) = \(\frac { 100 }{ 2 }\) = 50 which lies in the class 7-10
Here l = 7, F = 36, f= 40, h = 3
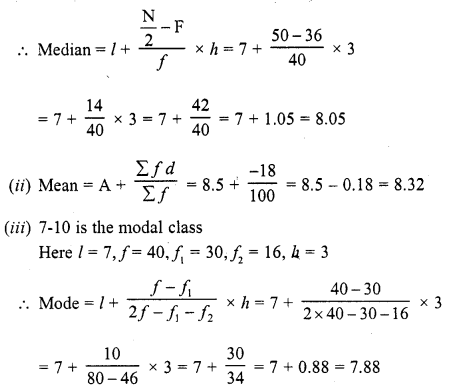
Question 15.
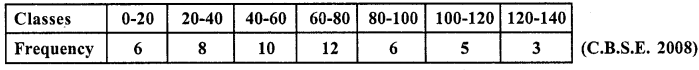
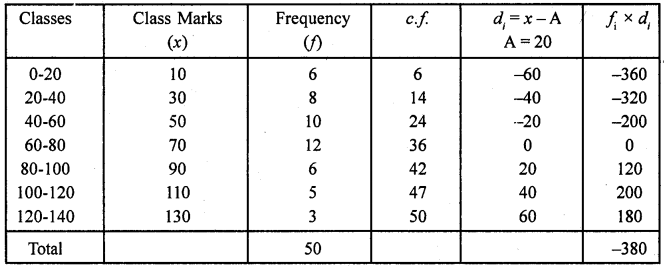
Find the mean, median and mode of the following data (C.B.S.E. 2008)
Solution:
Let assumed mean A = 70
(i) Here N = 50, then \(\frac { N }{ 2 }\) = \(\frac { 50 }{ 2 }\) = 25 which lies in the class 60-80
∴ l= 60, F= 24, f = 12 , h = 20
Question 16.
The following data gives the distribution of total monthly household expenditure of 200 families of a village. .Find the modal monthly expenditure of the families. Also, find the mean monthly expenditure:
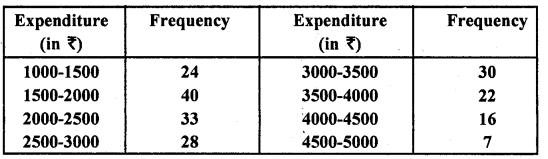
Solution:
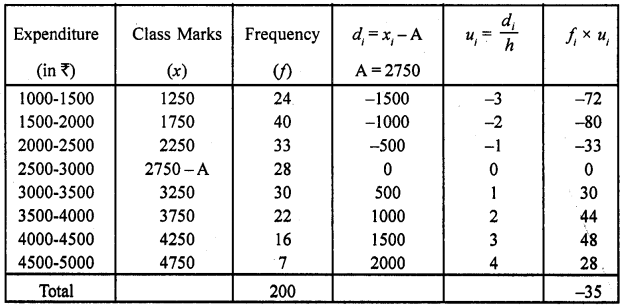
(i) We see that the c ass 1500-2000 has maximum frequency 40
∴ It is a modal class
Here l = 1500, f = 40 , f1 = 24 , f2 = 33 , h =500
Question 17.
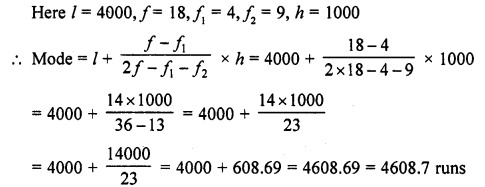
The given distribution shows the number of runs scored by some top batsmen of the world in one-day international cricket matches.
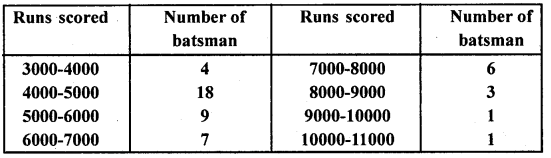
Find the mode of the data.
Solution:
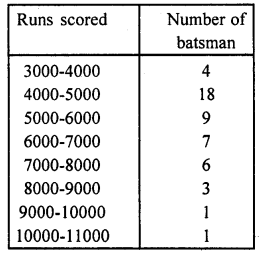
We see that class 4000-5000 has the maximum frequency 18
∴It is a modal class
Question 18.
The frequency distribution table of agriculture holdings in a village is given below:

Find the modal agriculture holdings of the village.
Solution:
Here the maximum class frequency is 80,
and the class corresponding to this frequency is 5-7.
So, the modal class is 5-7.
l (lower limit of modal class) = 5
f1 (frequency of the modal class) = 80
f0 (frequency of the class preceding the modal class) = 45
f2(frequency of the class succeeding the modal class) = 55
h (class size) = 2
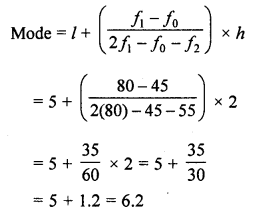
Hence, the modal agricultural holdings of the village is 6.2 hectares.
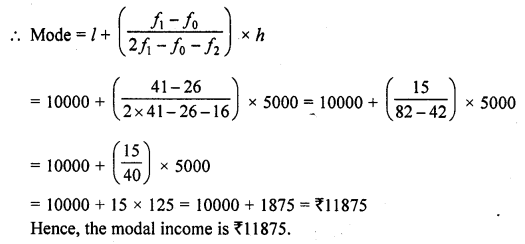
Question 19.
The monthly income of 100 families are given as below:
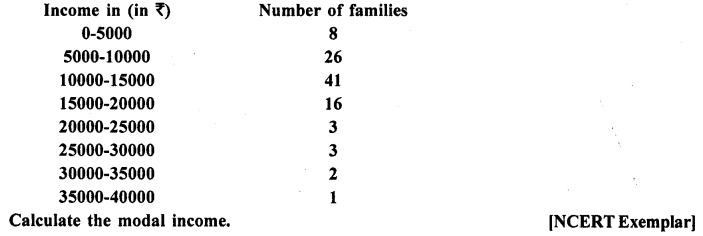
Solution:
In a given data, the highest frequency is 41, which lies in the interval 10000-15000.
Here, l = 10000,f1 = 41, f0 = 26,f2 = 16 and h = 5000
Hope given RD Sharma Class 10 Solutions Chapter 15 Statistics Ex 15.5 are helpful to complete your math homework.
If you have any doubts, please comment below. Learn Insta try to provide online math tutoring for you.