RD Sharma Class 10 Solutions Chapter 15 Statistics Ex VSAQS
These Solutions are part of RD Sharma Class 10 Solutions. Here we have given RD Sharma Class 10 Solutions Chapter 15 Statistics VSAQS
Other Exercises
- RD Sharma Class 10 Solutions Chapter 15 Statistics Ex 15.1
- RD Sharma Class 10 Solutions Chapter 15 Statistics Ex 15.2
- RD Sharma Class 10 Solutions Chapter 15 Statistics Ex 15.3
- RD Sharma Class 10 Solutions Chapter 15 Statistics Ex 15.4
- RD Sharma Class 10 Solutions Chapter 15 Statistics Ex 15.5
- RD Sharma Class 10 Solutions Chapter 15 Statistics Ex 15.6
- RD Sharma Class 10 Solutions Chapter 15 Statistics Ex VSAQS
- RD Sharma Class 10 Solutions Chapter 15 Statistics MCQS
Question 1.
Define Mean.
Solution:
The mean of a set of observations is equal to their sum divided by the total number of observations. Mean is also called an average.
Question 2.
What is the algebraic sum of deviations of a frequency distribution about its mean ?
Solution:
The algebraic sum of deviation of a frequency distribution about its mean is zero.
Question 3.
Which measure of central tendency is given by the x-coordinates of the point of intersection of the ‘more than’ ogive and ‘less than’ ogive ? (C.B.S.E. 2008)
Solution:
Median is given by the x-coordinate of the point of intersection of the more than ogive and less than ogive.
Question 4.
What is the value of the median of the data using the graph in the following figure of less than ogive and more than ogive ?
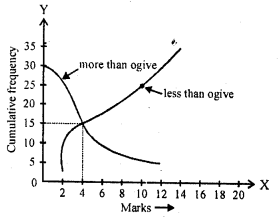
Solution:
Median = 4, because the coordinates of the point of intersection of two ogives at x-axis is 4.
Question 5.
Write the empirical relation between mean, mode and median.
Solution:
The empirical relation is Mode = 3
Median – 2 Mean
Question 6.
Which measure of central tendency can be determined graphically ?
Solution:
Median can be determinded graphically.
Question 7.
Write the modal class for the following frequency distribution:
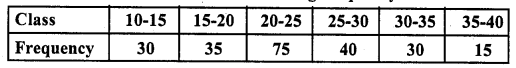
Solution:
The modal class is 20-25 as it has the maximum frequency of 75 in the given distribution.
Question 8.
A student draws a cumulative frequency curve for the marks obtained by 40 students of a class as shown below. Find the median marks obtained by the students of the class.
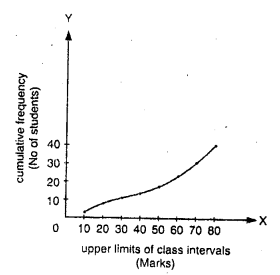
Solution:
Median marks
Here N = 40, then \(\frac { N }{ 2 }\) = \(\frac { 40 }{ 2 }\) = 20
From 20 on y-axis, draw a line parallel to the x-axis meeting the curve at P and from P, draw a perpendicular on x-axis meeting it at M. Then M is the median which is 50.
Question 9.
Write the median class for the following frequency distribution:

Solution:
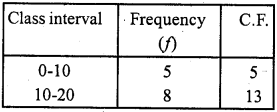
Here N = 100, then \(\frac { N }{ 2 }\) = 50
Which lies in the class 40-50 (∵32 < 50 < 60)
∴ Required class interval is 40-50
Question 10.
In the graphical representation of a frequency distribution, if the distance between mode and mean isk times the distance between median and mean, then write the value of k.
Solution:
We know that
Mode = 3 median – 2 mean ….(i)
Now mode – mean = k (median – mean) , ….(ii)
But mode – mean = 3 median – 2 mean [from (i)]
⇒ Mode – mean = 3 (median – mean) ….(iii)
Comparing (ii) and (iii)
k = 3
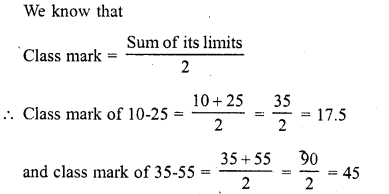
Question 11.
Find the class marks of classes 10-25 and 35-55. (C.B.S.E. 2008)
Solution:
Question 12.
Write the median class of the following distribution :

Solution:
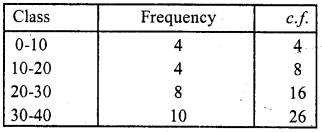
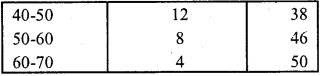
Here n = 50
∴ Median = \(\frac { n + 1 }{ 2 }\) = \(\frac { 5 + 1 }{ 2 }\) = 25.5 which lies in the class 30-40
Hence median class = 30-40.
Hope given RD Sharma Class 10 Solutions Chapter 15 Statistics VSAQS are helpful to complete your math homework.
If you have any doubts, please comment below. Learn Insta try to provide online math tutoring for you.