RD Sharma Class 10 Solutions Chapter 15 Statistics MCQS
These Solutions are part of RD Sharma Class 10 Solutions. Here we have given RD Sharma Class 10 Solutions Chapter 15 Statistics MCQS
Other Exercises
- RD Sharma Class 10 Solutions Chapter 15 Statistics Ex 15.1
- RD Sharma Class 10 Solutions Chapter 15 Statistics Ex 15.2
- RD Sharma Class 10 Solutions Chapter 15 Statistics Ex 15.3
- RD Sharma Class 10 Solutions Chapter 15 Statistics Ex 15.4
- RD Sharma Class 10 Solutions Chapter 15 Statistics Ex 15.5
- RD Sharma Class 10 Solutions Chapter 15 Statistics Ex 15.6
- RD Sharma Class 10 Solutions Chapter 15 Statistics Ex VSAQS
- RD Sharma Class 10 Solutions Chapter 15 Statistics MCQS
Mark the correct alternative in each of the following:
Question 1.
Which of the following is not a measure of central tendency :
(a) Mean
(b) Median
(c) Mode
(d) Standard deviation
Solution:
Standard deviation is not a measure of central tendency. Only mean, median and mode are measures. (d)
Question 2.
The algebraic sum of the deviations of a frequency distribution from its mean is
(a) always positive
(b) always negative
(c) 0
(d) a non-zero number
Solution:
The algebraic sum of the deviations of a frequency distribution from its mean is zero
Let x1, x2, x3, …… xn are observations and \(\overline { X }\) is the mean

Question 3.
The arithmetic mean of 1, 2, 3, ….. , n is

Solution:
Arithmetic mean of 1, 2, 3, …… n is

Question 4.
For a frequency distribution, mean, median and mode are connected by the relation
(a) Mode = 3 Mean – 2 Median
(b) Mode = 2 Median – 3 Mean
(c) Mode = 3 Median – 2 Mean
(d) Mode = 3 Median + 2 Mean
Solution:
The relation between mean, median and mode is: Mode = 3 Median – 2 Mean (c)
Question 5.
Which of the following cannot be determined graphically ?
(a) Mean
(b) Median
(c) Mode
(d) None of these
Solution:
Mean cannot be determind graphically, (a)
Question 6.
The median of a given frequency distribution is found graphically with the help of
(a) Histogram
(b) Frequency curve
(c) Frequency polygon
(d) Ogive
Solution:
Median of a given frequency can be found graphically by an ogive, (d)
Question 7.
The mode of a frequency distribution can be determined graphically from
(a) Histogram
(b) Frequency polygon
(c) Ogive
(d) Frequency curve
Solution:
Mode of frequency can be found graphically by an ogive, (c)
Question 8.
Mode is
(a) least frequent value
(b) middle most value
(c) most frequent value
(d) None of these
Solution:
Mode is the most frequency value of observation or a class, (c)
Question 9.
The mean of n observations is \(\overline { X }\) . If the first item is increased by 1, second by 2 and so on,
then the new mean is
![]()
Solution:
Mean of n observations = \(\overline { X }\)
By adding 1 to the first item, 2 to second item and so on, the new mean will be
Let x1, x2, x3,….. xn are the items whose mean is \(\overline { X }\) , then mean of
(x1+ 1) + (x2 + 2) + (x3 + 3) + …… (xn + n)

Question 10.
One of the methods of determining mode is
(a) Mode = 2 Median – 3 Mean
(b) Mode = 2 Median + 3 Mean
(c) Mode = 3 Median – 2 Mean
(d) Mode = 3 Median + 2 Mean
Solution:
Mode = 3 Median – 2 Mean (c)
Question 11.
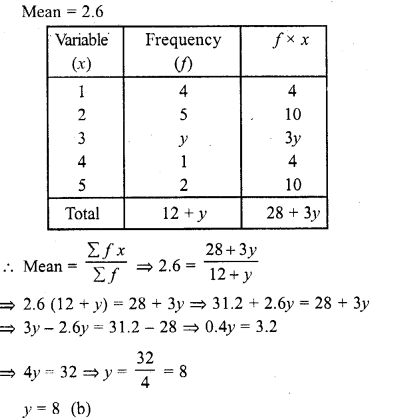
If the mean of the following distribution is 2.6, then the value of y is

(a) 3
(b) 8
(c) 13
(d) 24
Solution:
Question 12.
The relationship between mean, median and mode for a moderately skewed distribution is
(a) Mode = 2 Median – 3 Mean
(b) Mode = Median – 2 Mean
(c) Mode = 2 Median – Mean
(d) Mode = 3 Median – 2 Mean
Solution:
The relationship between mean, median and mode is Mode = 3 Median – 2 Mean, (d)
Question 13.
The mean of a discrete frequency distribution xi /fi ; i= 1, 2, …… n is given by

Solution:

Question 14.
If the arithmetic mean of x, x + 3, x + 6, x + 9, and x + 12 is 10, then x =
(a) 1
(b) 2
(c) 6
(d) 4
Solution:


Question 15.
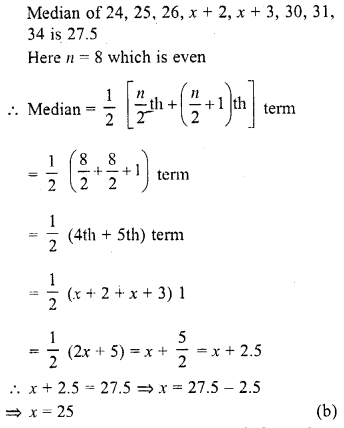
If the median of the data : 24, 25, 26, x + 2, x + 3, 30, 31, 34 is 27.5, then x =
(a) 27
(b) 25
(c) 28
(d) 30
Solution:
Question 16.
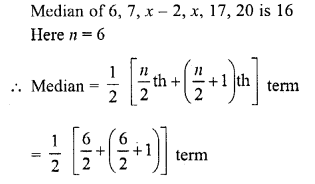
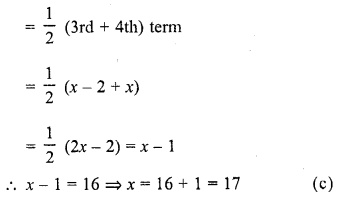
If the median of the data : 6, 7, x – 2, x, 17, 20, written in ascending order, is 16. Then x =
(a) 15
(b) 16
(c) 17
(d) 18
Solution:
Question 17.
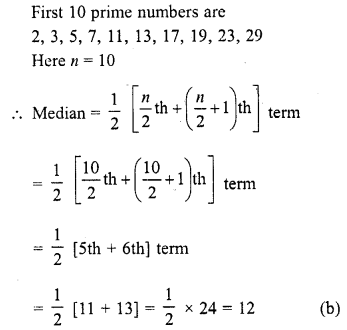
The median of first 10 prime numbers is
(a) 11
(b) 12
(c) 13
(d) 14
Solution:
Question 18.
If the mode of the data : 64,60, 48, x, 43, 48, 43, 34 is 43, then x + 3 =
(a) 44
(b) 45
(c) 46
(d) 48
Solution:
Mode of 64, 60, 48, x, 43, 48, 43, 34 is 43
∵ By definition mode is a number which has maximum frequency which is 43
∴ x = 43
∴ x + 3 = 43 + 3 = 46 (c)
Question 19.
If the mode of the data : 16, 15, 17, 16, 15, x, 19, 17, 14 is 15, then x =
(a) 15
(b) 16
(c) 17
(d) 19
Solution:
Mode of 16, 15, 17, 16, 15, x, 19, 17, 14 is 15
∵By definition mode of a number which has maximum frequency which is 15
∴ x = 15 (a)
Question 20.
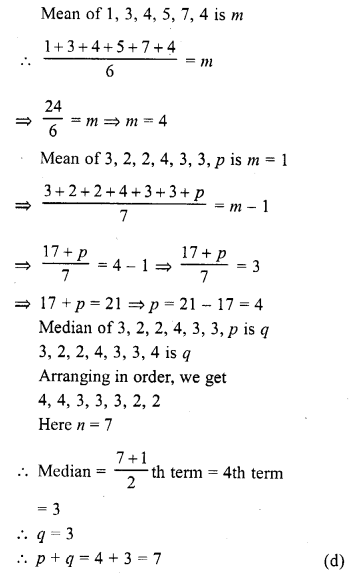
The mean of 1, 3, 4, 5, 7, 4 is m. The number 3, 2, 2, 4, 3, 3, p have mean m – 1 and median q. Then p + q =
(a) 4
(b) 5
(c) 6
(d) 7
Solution:
Question 21.
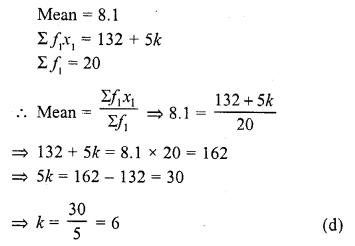
If the mean of a frequency distribution is 8.1 and Σfixi = 132 + 5k, Σfi = 20, then k =
(a) 3
(b) 4
(c) 5
(d) 6
Solution:
Question 22.
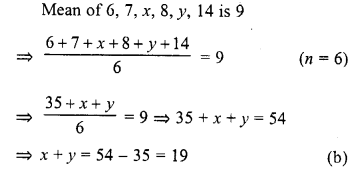
If the mean of 6, 7, x, 8, y, 14 is 9, then
(a)x+y = 21
(b)x+y = 19
(c) x -y = 19
(d) v -y = 21
Solution:
Question 23.
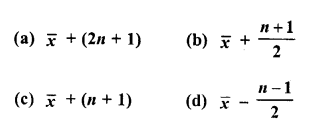
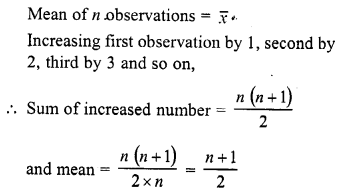
The mean of n observations is \(\overline { x }\) If the first observation is increased by 1, the second by 2, the third by 3, and so on, then the new mean is
Solution:
Question 24.
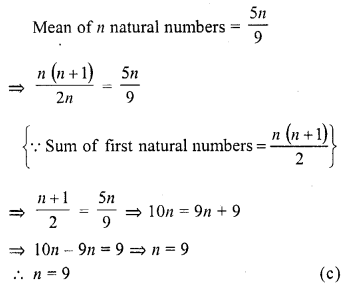
If the mean of first n natural numbers is \(\frac { 5n }{ 9 }\) then n =
(a) 5
(b) 4
(c) 9
(d) 10
Solution:
Question 25.
The arithmetic mean and mode of a data are 24 and 12 respectively, then its median is
(a) 25
(b) 18
(c) 20
(d) 22
Solution:
Arithmetic mean = 24
Mode = 12
∴ But mode = 3 median – 2 mean
⇒ 12 = 3 median – 2 x 24
⇒ 12 = 3 median =-48
⇒ 12 + 48 = 3 median
⇒ 3 median = 60
Median = \(\frac { 60 }{ 3 }\) = 20 (c)
Question 26.
The mean of first n odd natural number is

Solution:
![]()
Question 27.
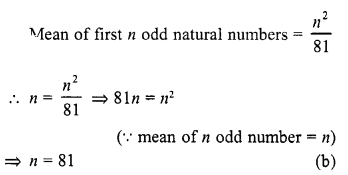
The mean of first n odd natural numbers is \(\frac { n2 }{ 81 }\) , then n = 81
(a) 9
(b) 81
(c) 27
(d) 18
Solution:
Question 28.
If the difference of mode and median of a data is 24, then the difference of median and mean is
(a) 12
(b) 24
(c) 8
(d) 36
Solution:
Difference of mode and median = 24
Mode = 3 median – 2 mean
⇒ Mode – median = 2 median – 2 mean
⇒ 24 = 2 (median – mean)
⇒ Median – mean = \(\frac { 24 }{ 2 }\) = 12 (a)
Question 29.
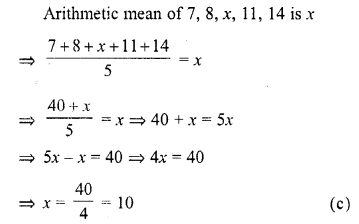
If the arithmetic mean of 7, 8, x, 11, 14 is x, then x =
(a) 9
(b) 9.5
(c) 10
(d) 10.5
Solution:
Question 30.
If mode of a series exceeds its mean by 12, then mode exceeds the median by
(a) 4
(b) 8
(c) 6
(d) 10
Solution:
Mode of a series = Its mean + 12
Mean = mode – 12
Mode = 3 median – 2 mean
Mode = 3 median – 2 (mode -12)
⇒ Mode = 3 median – 2 mode + 24
⇒ Mode + 2 mode – 3 median = 24
⇒ 3 mode – 3 median = 24
⇒ 3 (mode – median) = 24
⇒ Mode – medain = \(\frac { 24 }{ 3 }\) = 8 (b)
Question 31.
If the mean of first n natural number is 15, then n =
(a) 15
(b) 30
(c) 14
(d) 29
Solution:


Question 32.
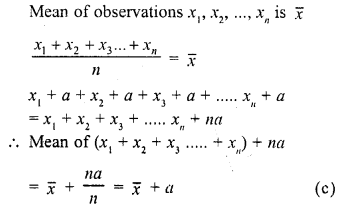
If the mean of observations x1, x2, …, xn is \(\overline { x }\) , then the mean of x1 + a, x2 + a,…, xn + a is

Solution:
Question 33.
Mean of a certain number of observations is \(\overline { x }\) If each observation is divided by m (m ≠ 0) and increased by n, then the mean of new observation is
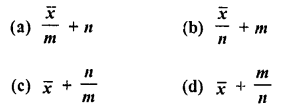
Solution:
Mean of some observations = \(\overline { x }\)
If each observation is divided by m and increased by n
Then mean will be = \(\frac { \overline { x } }{ m }\) +n
Question 34.
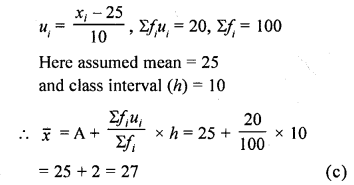
If ui= \(\frac { xi-25\quad }{ 10 }\) Σfiui = 20, Σfi = 100, then \(\overline { x }\)
(a) 23
(b) 24
(c) 27
(d) 25
Solution:
Question 35.
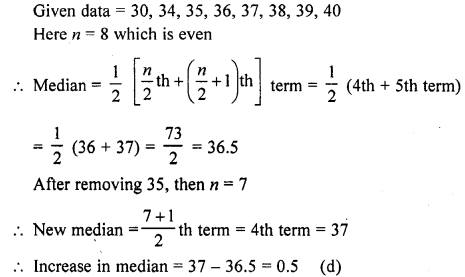
If 35 is removed from the data : 30, 34, 35, 36, 37, 38, 39, 40, then the median increases by
(a) 2
(b) 1.5
(c) 1
(d) 0.5
Solution:
Question 36.
While computing mean of grouped data, we assume that the frequencies are
(a) evenly distributed over all the classes.
(b) centred at the class marks of the classes.
(c) centred at the upper limit of the classes.
(d) centred at the lower limit of the classes.
Solution:
In computing the mean of grouped data, the frequencies are centred at the class marks of the classes. (b)
Question 37.

Solution:


Question 38.
For the following distribution:

the sum of the lower limits of the median and modal class is
(a) 15
(b) 25
(c) 30
(d) 35
Solution:
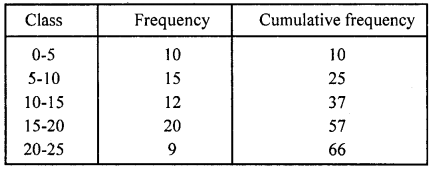
Now, \(\frac { N }{ 2 }\) = \(\frac { 66 }{ 2 }\) = 33, which lies in the interval 10-15.
Therefore, lower limit of the median class is 10.
The highest frequency is 20, which lies in the interval 15-20.
Therefore, lower limit of modal class is 15.
Hence, required sum is 10 + 15 = 25. (b)
Question 39.
For the following distribution:

the modal class is
(a) 10-20
(b) 20-30
(c) 30-40
(d) 50-60
Solution:
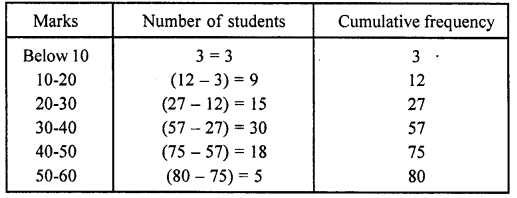
Here, we see that the highest frequency is 30, which lies in the interval 30-40. (c)
Question 40.
Consider the following frequency distribution:

The difference of the upper limit of the median class and the lower limit of the modal class is
(a) 0
(b) 19
(c) 20
(d) 38
Solution:
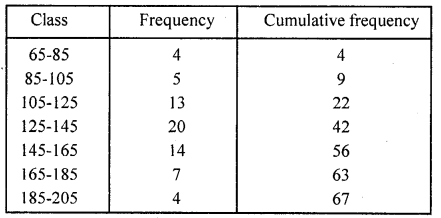
Here, \(\frac { N }{ 2 }\) = \(\frac { 67 }{ 2 }\) = 33.5 which lies in the interval 125-145.
Hence, upper limit of median class is 145.
Here, we see that the highest frequency is 20 which lies in 125-145.
Hence, the lower limit of modal class is 125.
∴ Required difference = Upper limit of median class – Lower limit of modal class
= 145 – 125 = 2 (C)
Question 41.
In the formula \(\overline { X }\) = a + \(\frac { \Sigma fidi }{ \Sigma fi }\) for finding the mean of grouped data di’s are deviations from a of
(a) lower limits of classes
(b) upper limits of classes
(c) mid-points of classes
(d) frequency of the class marks
Solution:
We know that, di = xi – a
i .e , di‘s are the deviation from a mid-points of the classes. (c)
Question 42.
The abscissa of the point of intersection of less than type and of the more than type cumulative frequency curves of a grouped data gives its
(a) mean
(b) median
(c) mode
(d) all the three above
Solution:
Since, the intersection point of less than ogive and more than ogive gives the median on the abscissa. (b)
Question 43.
Consider the following frequency distribution:

The upper limit of the median class is
(a) 17
(b) 17.5
(c) 18
(d) 18.5
Solution:
Given, classes are not continuous, so we make continuous by subtracting 0.5 from lower limit and adding 0.5 to upper limit of each class.
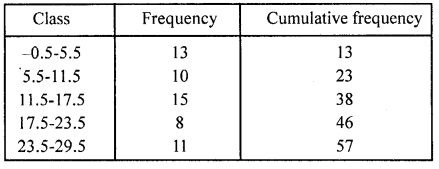
Here, \(\frac { N }{ 2 }\) = \(\frac { 57 }{ 2 }\) = 28.5, which lies in the interval 11.5-17.5.
Hence, the upper limit is 17.5.
Hope given RD Sharma Class 10 Solutions Chapter 15 Statistics MCQS are helpful to complete your math homework.
If you have any doubts, please comment below. Learn Insta try to provide online math tutoring for you.