RD Sharma Class 9 Solutions Chapter 16 Circles Ex 16.1

RD Sharma Class 9 Solutions Chapter 16 Circles Ex 16.1

These Solutions are part of RD Sharma Class 9 Solutions. Here we have given RD Sharma Class 9 Solutions Chapter 16 Circles Ex 16.1

Other Exercises

Question 1.
Draw a line segment of length 8.6 cm. Bisect it and measure the length of each part.
Solution:
Steps of construction :
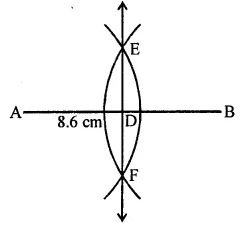
(i) Draw a line segment AB = 8.6 cm.
(ii) With centres A and B, and radius more than half of AB, draw arcs which intersect each other at E and F, on both sides of AB.
(iii) Join EF which intersects AB at D.
D is the required mid point of AB.
Measuring each part, it is 4.3 cm long.
RD Sharma Class 9 Solutions Chapter 16 Circles Ex 16.1 Q1.1

Question 2.
Draw a line segment AB of length 5.8 cm. Draw the perpendicular bisector of this line segment.
Solution:
Steps of construction :
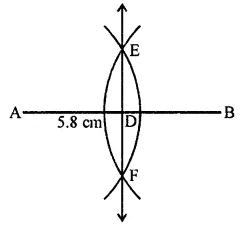
(i) Draw a line segment AB = 5.8 cm.
(ii) With centres A and B and radius more than half of AB, draw arcs intersecting each other at E and F.
(iii) Join EF which is the required perpendicular bisector of AB.
RD Sharma Class 9 Solutions Chapter 16 Circles Ex 16.1 Q2.1

Question 3.
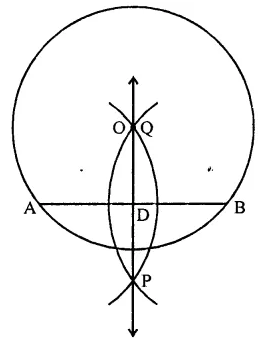
Draw a circle with centre at point O and radius 5 cm. Draw its chord AB, draw the perpendicular bisector of line segment AB. Does it pass through the centre of the circle?
Solution:
Steps of construction :
(i) Draw a circle with centre O and radius 5 cm.
(ii) Draw a chord AB of the circle.
(iii) With centres A and B and radius more than half of AB draw arcs intersecting each other at P and Q.
(iv) Join PQ which intersects AB at D and passes through O, the centre of the circle.
RD Sharma Class 9 Solutions Chapter 16 Circles Ex 16.1 Q3.1

Question 4.
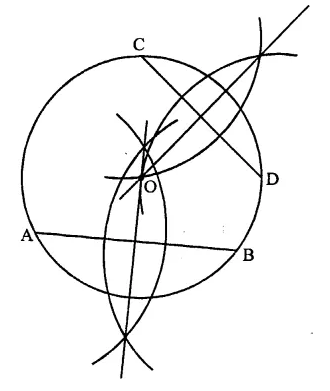
Draw a circle with centre at point O. Draw its two chords AB and CD such that AB is not parallel to CD. Draw the perpendicular bisectors of AB and CD. At what point do they intersect?
Solution:
Steps of construction :
(i) Draw a circle with centre O and a suitable radius.
(ii) Draw two chords AB and CD which are not parallel to each other.
(iii) Draw the perpendicular bisectors of AB and CD with the help of ruler and compasses. We see that these two chords intersect each other at the centre O, of the circle.
RD Sharma Class 9 Solutions Chapter 16 Circles Ex 16.1 Q4.1

Question 5.
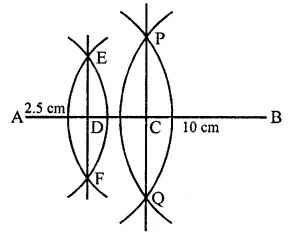
Draw a line segment of length 10 cm and bisect it. Further bisect one of the equal parts and measure its length.
Solution:
Steps of construction :
(i) Draw a line segment AB = 10 cm.
(ii) With the help of ruler and compasses, bisect AB at C.
(iii) Bisect again AC at D.
Measuring AD, it is 2.5 cm long.
RD Sharma Class 9 Solutions Chapter 16 Circles Ex 16.1 Q5.1

Question 6.
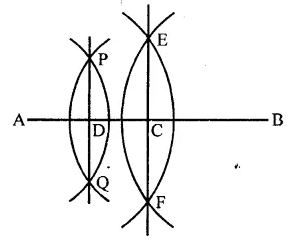
Draw a line segment AB and bisect it. Bisect one of the equal parts to obtain a line segment of length \(\frac { 1 }{ 2 }\) (AB).
Solution:
Steps of construction :
(i) Draw a line segment AB.
(ii) With the help of ruler and compasses, draw the bisector of AB which bisects AB at C.
(iii) Similarly, in the same way draw the bisector of AC at D.
We see that AC = \(\frac { 1 }{ 2 }\) (AB).
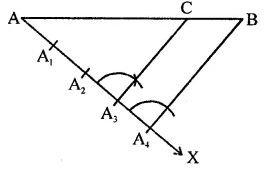
RD Sharma Class 9 Solutions Chapter 16 Circles Ex 16.1 Q6.1

Question 7.
Draw a line segment AB and by ruler and compasses, obtain a line segment of length \(\frac { 3 }{ 4 }\) (AB).
Solution:
Steps of construction :
(i) Draw a line segment AB.
(ii) Draw a ray AX making an acute angle with A3 and equal 4 parts at A1, A2, A3 and A4.
(iii) JoinA4B.
(iv) From A3, draw a line parallel to A4B which meets AB at C.
C is the required point and AC = \(\frac { 3 }{ 4 }\) (AB).
RD Sharma Class 9 Solutions Chapter 16 Circles Ex 16.1 Q7.1

Hope given RD Sharma Class 9 Solutions Chapter 16 Circles Ex 16.1 are helpful to complete your math homework.

If you have any doubts, please comment below. Learn Insta try to provide online math tutoring for you.

RD Sharma Class 9 Solutions Chapter 25 Probability MCQS

RD Sharma Class 9 Solutions Chapter 25 Probability MCQS

These Solutions are part of RD Sharma Class 9 Solutions. Here we have given RD Sharma Class 9 Solutions Chapter 25 Probability MCQS

Other Exercises

Mark the correct alternative in each of the following:

Question 1.
The probability of an impossible event is
(a) 1
(b) 0
(c) less than 0
(d) greater than 1
Solution:
The probability of an impossible event is 0 (b)

Question 2.
The probability on a certain event is
(a) 0
(b) 1
(c) greater than 1
(d) less than 1
Solution:
The probability of a certain event is 1 (b)

Question 3.
The probability of an event of a trial is
(a) 1
(b) 0
(c) less than 1
(d) more than 1
Solution:
The probability of an even of a trial is less than 1 (c)

Question 4.
Which of the following cannot be the probability of an event?
(a) \(\frac { 1 }{ 3 } \)
(b) \(\frac { 3 }{ 5 } \)
(c) \(\frac { 5 }{ 3 } \)
(d) 1
Solution:
The probability of an event is less than 1
\(\frac { 5 }{ 3 } \) i.e .\(1\frac { 2 }{ 3 } \) is not the probability

Question 5.
Two coins are tossed simultaneously. The probability of getting atmost one head is
(a) \(\frac { 1 }{ 4 } \)
(b) \(\frac { 3 }{ 4 } \)
(c) \(\frac { 1 }{ 2 } \)
(d) \(\frac { 1 }{ 4 } \)
Solution:
Total number of possible events (n) = 2 + 2 = 4
Number of events coming at the most 1 head (m) 2 times + 1 times = 3
Probability P(A) = \(\frac { m }{ n } \) = \(\frac { 3 }{ 4 } \) (b)

Question 6.
A coin is tossed 1000 times, if the probability of getting a tail is 3/8, how many times head is obtained?
(a) 525
(b) 375
(c) 625
(d) 725
Solution:
No. of times a coin is tossed (n) = 1000
Probability of getting a tail = \(\frac { 3 }{ 8 } \)
Let No. of tail come = x
Probability P(A) = \(\frac { m }{ n } =\frac { x }{ 1000 } \)
\(\frac { x }{ 1000 } \) = \(\frac { 3 }{ 8 } \)
=> \(\frac { x }{ 1000 } =\frac { 3 }{ 8 } \) => \(\frac { 3X1000 }{ 8 } =3X125\)
=> x = 375
∴ No. of heads are obtained = 1000 – 375 = 625 (c)

Question 7.
A dice is rolled 600 times and the occurrence of the outcomes 1, 2, 3, 4, 5 and 6 are given below:
RD Sharma Class 9 Solutions Chapter 25 Probability MCQS 7.1
The probability of getting a prime number is
(a)\(\frac { 1 }{ 3 } \)
(b)\(\frac { 2 }{ 3 } \)
(c)\(\frac { 49 }{ 60 } \)
(d)\(\frac { 39 }{ 125 } \)
Solution:
Total number of times a dice is rolled (n) = 600
RD Sharma Class 9 Solutions Chapter 25 Probability MCQS 7.2
Now total number of times getting a prime number i.e. 2, 3, 5, (m) = 30 + 120 + 50 = 200
Probability P(A) = \(\frac { m }{ n } \) = \(\frac { 200 }{ 600 } \) = \(\frac { 1 }{ 3 } \) (a)

Question 8.
The percentage of attendance of different classes in a year in a school is given below:
RD Sharma Class 9 Solutions Chapter 25 Probability MCQS 8.1
What is the probability that the class attendance is more than 75%?
(a) \(\frac { 1 }{ 6 } \)
(b) \(\frac { 1 }{ 3 } \)
(c) \(\frac { 5 }{ 6 } \)
(d) \(\frac { 1 }{ 2 } \)
Solution:
Percentage of attendance of different classes
RD Sharma Class 9 Solutions Chapter 25 Probability MCQS 8.2
Total attendance more than 75% (m) VIII,VII and VI = 3 classes
and total number of classes (n) = 6
Probability P(A) = \(\frac { 3 }{ 6 } \) = \(\frac { 1 }{ 2 } \).

Question 9.
A bag contains 50 coins and each coin is marked from 51 to 100. One coin is picked at random.
The probability that the number on the coin is not a prime number, is
(a) \(\frac { 1 }{ 5 } \)
(b) \(\frac { 3 }{ 5 } \)
(c) \(\frac { 2 }{ 5 } \)
(d) \(\frac { 4 }{ 5 } \)
Solution:
Total number of coins (n) = 50
Prime numbers between 51 to 100 are 53, 59, 6, 67, 71, 73, 79, 83, 89, 97 = 10
Numbers which are not primes (m) = 50 – 10 = 40
Probability P(A) = \(\frac { m }{ n } \) = \(\frac { 40 }{ 50 } \) = \(\frac { 4 }{ 5 } \)(d)

Question 10.
In a football match, Ronaldo makes 4 pals from 10 penalty kids. The probability of converting a penalty kick into a goal by Ronaldo,is
(a) \(\frac { 1 }{ 4 } \)
(b) \(\frac { 1 }{ 6 } \)
(c) \(\frac { 1 }{ 3 } \)
(d) \(\frac { 2 }{ 5 } \)
Solution:
No. of penalty kicks (n) = 10
No. of goal scored (m) = 4
Probability of converting a penally Into goals P(A) = \(\frac { 4 }{ 10 } \) = \(\frac { 2 }{ 5 } \)(d)

Hope given RD Sharma Class 9 Solutions Chapter 25 Probability MCQS are helpful to complete your math homework.

If you have any doubts, please comment below. Learn Insta try to provide online math tutoring for you.

RD Sharma Class 9 Solutions Chapter 23 Graphical Representation of Statistical Data MCQS

RD Sharma Class 9 Solutions Chapter 23 Graphical Representation of Statistical Data MCQS

These Solutions are part of RD Sharma Class 9 Solutions. Here we have given RD Sharma Class 9 Solutions Chapter 23 Graphical Representation of Statistical Data MCQS

Other Exercises

Question 1.
Which one of the following is not the graphical representation of statistical data:
(a) Bar graph
(b) Histogram
(c) Frequency polygon
(d) Cumulative frequency distribution
Solution:
Cumulative frequency distribution is not a graphical method.

Question 2.
In a frequency distribution, ogives are graphical representation of
(a) Frequency
(b) Relative frequency
(c) Cumulative
(d) Raw data
Solution:
Ogive is the graphical representation of cumulative frequency.

Question 3.
A frequency polygon is constructed by plotting frequency of the class interval and the
(a) upper limit of the class
(b) lower limit of the class
(c) mid value of the class
(d) any values of the class
Solution:
A frequency polygon is constructed by plotting frequency of the class interval and mid value of the class.

Question 4.
In a histogram the area of each rectangle is proportional to
(a) the class mark of the corresponding class interval
(b) the class size of the corresponding class interval
(c) frequency of the corresponding class interval
(d) cumulative frequency of the corresponding class interval
Solution:
In histogram, the area of each rectangle is proportional to frequency of the corresponding class intervals.

Question 5.
In the ‘less than’ type of ogive the cumulative frequency is plotted against
(a) the lower limit of the concerned class interval
(b) the upper limit of the concerned class interval
(c) the mid-value of the concerned class interval
(d) any value of the concerned class interval
Solution:
In the ‘less than’ type of ogive cumulative frequency is plotted against the upper limit of the concerned class interval,

Question 6.
In a histogram the class intervals or the groups are taken along
(a) Y-axis
(b) X-axis
(c) both of X-axis and Y-axis
(d) in between X and Y axis
Solution:
In histogram, the class intervals or the groups are taken along X-axisA

Question 7.
A histogram is a pictorial representation of the grouped data in which class intervals and frequency are respectively taken along
(a) vertical axis and horizontal axis
(b) vertical axis only
(c) horizontal axis only
(d) horizontal axis and vertical axis
Solution:
A histogram is a pictorial representation of the grouped data in which class interval and frequency are respectively taken along horizontal axis and vertical axis.

Question 8.
In a histogram, each class rectangle is constructed with base as
(a) frequency
(b) class-intervals
(c) range
(d) size of the class
Solution:
In a histogram each class rectangle is constructed with base as class intervals.

Hope given RD Sharma Class 9 Solutions Chapter 23 Graphical Representation of Statistical Data MCQS are helpful to complete your math homework.

If you have any doubts, please comment below. Learn Insta try to provide online math tutoring for you.

RD Sharma Class 9 Solutions Chapter 23 Graphical Representation of Statistical Data Ex 23.3

RD Sharma Class 9 Solutions Chapter 23 Graphical Representation of Statistical Data Ex 23.3

These Solutions are part of RD Sharma Class 9 Solutions. Here we have given RD Sharma Class 9 Solutions Chapter 23 Graphical Representation of Statistical Data Ex 23.3

Other Exercises

Question 1.
Construct a histogram for the following data:
RD Sharma Class 9 Solutions Chapter 23 Graphical Representation of Statistical Data Ex 23.3 1.1
Solution:
RD Sharma Class 9 Solutions Chapter 23 Graphical Representation of Statistical Data Ex 23.3 1.2
Histogram is given below:
RD Sharma Class 9 Solutions Chapter 23 Graphical Representation of Statistical Data Ex 23.3 1.3

Question 2.
The distribution of heights (in cm) of 96 children is given below. Construct a histogram and a frequency polygon on the same axes.
RD Sharma Class 9 Solutions Chapter 23 Graphical Representation of Statistical Data Ex 23.3 2.1
Solution:
RD Sharma Class 9 Solutions Chapter 23 Graphical Representation of Statistical Data Ex 23.3 2.2
Histogram and frequency polygon is given here.
Draw midpoints Of each rectangle at the top and join them to get a frequency polygon.
RD Sharma Class 9 Solutions Chapter 23 Graphical Representation of Statistical Data Ex 23.3 2.3

Question 3.
The time taken, in seconds, to solve a problem by each of 25 pupils is as follows:
16, 20, 26, 27, 28, 30, 33, 37, 38, 40, 42, 43, 46, 46, 46, 48, 49, 50, 53, 58, 59, 60, 64, 52, 20
(a) Construct a frequency distribution for these data, using a class interval of 10 seconds.
(b) Draw a histogram to represent the frequency distribution.
Solution:
Lowest observation = 16,
Highest observation = 64
RD Sharma Class 9 Solutions Chapter 23 Graphical Representation of Statistical Data Ex 23.3 3.1
Below is given the histogram
RD Sharma Class 9 Solutions Chapter 23 Graphical Representation of Statistical Data Ex 23.3 3.2

Question 4.
Draw, in the same diagram, a histogram and a frequency polygon to represent the following data which shows the monthly cost of living index of a city in a period of 2 years:
RD Sharma Class 9 Solutions Chapter 23 Graphical Representation of Statistical Data Ex 23.3 4.1
Solution:
RD Sharma Class 9 Solutions Chapter 23 Graphical Representation of Statistical Data Ex 23.3 4.2

Question 5.
The following is the distribution of total household expenditure (in Rs.) of manual worker in a city:
RD Sharma Class 9 Solutions Chapter 23 Graphical Representation of Statistical Data Ex 23.3 5.1
Draw a histogram and a frequency polygon representing the above data.
Solution:
RD Sharma Class 9 Solutions Chapter 23 Graphical Representation of Statistical Data Ex 23.3 5.2
Here is given histogram and frequency polygon.
RD Sharma Class 9 Solutions Chapter 23 Graphical Representation of Statistical Data Ex 23.3 5.3

Question 6.
The following table gives the distribution of IQ’s (intelligence quotients) of 60 pupils of class V in a school:
RD Sharma Class 9 Solutions Chapter 23 Graphical Representation of Statistical Data Ex 23.3 6.1
Draw a frequency polygon for the above data.
Solution:
RD Sharma Class 9 Solutions Chapter 23 Graphical Representation of Statistical Data Ex 23.3 6.2
Now plot the (mid point, frequency) on the graph and join them to get a frequency polygon.
RD Sharma Class 9 Solutions Chapter 23 Graphical Representation of Statistical Data Ex 23.3 6.3

Question 7.
Draw a histogram for the daily earnings of 30 drug stores in the following table:
RD Sharma Class 9 Solutions Chapter 23 Graphical Representation of Statistical Data Ex 23.3 7.1
Solution:
RD Sharma Class 9 Solutions Chapter 23 Graphical Representation of Statistical Data Ex 23.3 7.2
Hisotgram is given below:
RD Sharma Class 9 Solutions Chapter 23 Graphical Representation of Statistical Data Ex 23.3 7.3

Question 8.
The monthly profits (in t) of 100 shops are distributed as follows:
RD Sharma Class 9 Solutions Chapter 23 Graphical Representation of Statistical Data Ex 23.3 8.1
Draw a histogram for the data and show the frequency polygon for it.
Solution:
RD Sharma Class 9 Solutions Chapter 23 Graphical Representation of Statistical Data Ex 23.3 8.2
Histogram and frequency polygon is given below:
RD Sharma Class 9 Solutions Chapter 23 Graphical Representation of Statistical Data Ex 23.3 8.3

Hope given RD Sharma Class 9 Solutions Chapter 23 Graphical Representation of Statistical Data Ex 23.3 are helpful to complete your math homework.

If you have any doubts, please comment below. Learn Insta try to provide online math tutoring for you.

RD Sharma Class 9 Solutions Chapter 23 Graphical Representation of Statistical Data Ex 23.2

RD Sharma Class 9 Solutions Chapter 23 Graphical Representation of Statistical Data Ex 23.2

These Solutions are part of RD Sharma Class 9 Solutions. Here we have given RD Sharma Class 9 Solutions Chapter 23 Graphical Representation of Statistical Data Ex 23.2

Other Exercises

Question 1.
Explain the reading and interpretation of bar graphs.
Solution:
Reading and interpretation of the bar graph:
The first step in reading a bar graph is to know what it represents or what is the information given by it. For this, we read the captions which are generally written just below the horizontal line (x-axis) and adjacent to vertical line (y-axis). After knowing that what does a bar graph represent we read the scale so that we can know the precise values in the given data.
After reading a bar graph one must be able to draw certain conclusions from it. Drawing some conclusions from a given bar graph means interpretation of the bar graph.

Question 2.
Read the following bar graph and answer the following questions:
(i) What information is given by the bar graph?
(ii) In which year the export is minimum?
(iii) In which year the import is maximum?
(iv) In which year the difference of the values of export and import is maximum?
RD Sharma Class 9 Solutions Chapter 23 Graphical Representation of Statistical Data Ex 23.2 2.1
Solution:
After reading the bar graph. We find:
(i) Export and import in 100 crores of rupees year wise.
(ii) In the year 1982-83, export is minimum i.e. 100 crores.
(iii) In the year 1986-87, import is maximum i.e. 22 hundred crores.
(iv) In the year 1986-87, the difference of the values of import and export is maximum i.e. 22 – 12 = 10 x 100 crore.

Question 3.
The following bar graph show’s the results of an annual examination in a secondary school.
Read the bar graph and choose the correct alternative in each of the following:
(i) The pair of classes in which the results of boys and girls are inversely proportional are:
(a) VI, VIII (b) VI, IX (c) VIII, IX (d) VIII, X
(ii) The class having the lowest failure rate of girls is
(a) VII (b) X (c) IX (d) VIII
(iii) The class having the lowest pass rate of students is
(a) VI (b) VII (c) VIII (d) IX
RD Sharma Class 9 Solutions Chapter 23 Graphical Representation of Statistical Data Ex 23.2 3.1
Solution:
After reading the given bar graph, we find that
(i) The pair of classes in which the results of boys and girls are inversely proportional is VI and IX as in VI, 80% boys and 70% girls and in IX, 70% boys and 80% girls are the results.
(ii) Lowest failure of girls of students is VII as pass % is 100%.
(iii) Class having the lowest pass rate is VII boys as it is 50% only.

Question 4.
The following data gives the number (in thousands) of applicants registered with an Employment Exchange during, 1995-2000:
RD Sharma Class 9 Solutions Chapter 23 Graphical Representation of Statistical Data Ex 23.2 4.1
Construct a bar graph to represent the above data.
RD Sharma Class 9 Solutions Chapter 23 Graphical Representation of Statistical Data Ex 23.2 4.2
Solution:
RD Sharma Class 9 Solutions Chapter 23 Graphical Representation of Statistical Data Ex 23.2 4.3
Bar graph of the above is given below:
RD Sharma Class 9 Solutions Chapter 23 Graphical Representation of Statistical Data Ex 23.2 4.4

Question 5.
The production of saleable steel in some of the steel plants of our country during 1999 is given below:
RD Sharma Class 9 Solutions Chapter 23 Graphical Representation of Statistical Data Ex 23.2 5.1
Construct a bar graph to represent the above data on a graph paper by using the scale 1 big divisions = 20 thousands tonnes.
Solution:
RD Sharma Class 9 Solutions Chapter 23 Graphical Representation of Statistical Data Ex 23.2 5.2
Bar graph of the above data is given below:
RD Sharma Class 9 Solutions Chapter 23 Graphical Representation of Statistical Data Ex 23.2 5.3

Question 6.
The following table gives the route length (in thousand kilometres) of the Indian Railways in some of the years:
RD Sharma Class 9 Solutions Chapter 23 Graphical Representation of Statistical Data Ex 23.2 6.1
Represent the above data with the help of a bar graph.
Solution:
RD Sharma Class 9 Solutions Chapter 23 Graphical Representation of Statistical Data Ex 23.2 6.2
RD Sharma Class 9 Solutions Chapter 23 Graphical Representation of Statistical Data Ex 23.2 6.3

Question 7.
The following data gives the amount of loans (in crores of rupees) disbursed by a bank during some years:
RD Sharma Class 9 Solutions Chapter 23 Graphical Representation of Statistical Data Ex 23.2 7.1
(i) Represent the above data with the help of a bar graph.
(ii) With the help of the bar graph, indicate the year in which amount of loan is not increased over that of the preceding year.
Solution:
RD Sharma Class 9 Solutions Chapter 23 Graphical Representation of Statistical Data Ex 23.2 7.2

Question 8.
The following table shows the interest paid by a company (in lakhs):
RD Sharma Class 9 Solutions Chapter 23 Graphical Representation of Statistical Data Ex 23.2 8.1
Draw the bar graph to represent the above information.
Solution:
RD Sharma Class 9 Solutions Chapter 23 Graphical Representation of Statistical Data Ex 23.2 8.2
RD Sharma Class 9 Solutions Chapter 23 Graphical Representation of Statistical Data Ex 23.2 8.3

Question 9.
The following data shows the average age of men in various countries in a certain year:
RD Sharma Class 9 Solutions Chapter 23 Graphical Representation of Statistical Data Ex 23.2 9.1
Represent the above information by a bar graph.
Solution:
RD Sharma Class 9 Solutions Chapter 23 Graphical Representation of Statistical Data Ex 23.2 9.2

Question 10.
The following data gives the production of foodgrains (in thousand tonnes) for some years:
RD Sharma Class 9 Solutions Chapter 23 Graphical Representation of Statistical Data Ex 23.2 10.1
Represent the above data with the help of a bar graph.
Solution:
RD Sharma Class 9 Solutions Chapter 23 Graphical Representation of Statistical Data Ex 23.2 10.2
RD Sharma Class 9 Solutions Chapter 23 Graphical Representation of Statistical Data Ex 23.2 10.3

Question 11.
The following data gives the amount of manure (in thousand tonnes) manufactured by a company during some years:
RD Sharma Class 9 Solutions Chapter 23 Graphical Representation of Statistical Data Ex 23.2 11.1
(i) Represent the above data with the help of a bar graph.
(ii) Indicate with the help of the bar graph the year in which the amount of manufactured by the company was maximum.
(in) Choose the correct alternative:
The consecutive years during which there was maximum decrease in manure production are:
(a) 1994 and 1995
(b) 1992 and 1993
(c) 1996 and 1997
(d) 1995 and 1996
Solution:
RD Sharma Class 9 Solutions Chapter 23 Graphical Representation of Statistical Data Ex 23.2 11.2
RD Sharma Class 9 Solutions Chapter 23 Graphical Representation of Statistical Data Ex 23.2 11.3
(ii) The maximum amount of manure manufactured in the year 1994, i.e. 45 thousand tonnes.
(iii) There was maximum decrease in manure production in 1996 and 1997.

Question 12.
The following data gives the demand estimates of the Government of India, Department of Electronics for the personnel in the Computer sector during the Eighth Plan period (1990-95):
RD Sharma Class 9 Solutions Chapter 23 Graphical Representation of Statistical Data Ex 23.2 12.1
Represent the data with the help of a bar graph. Indicate with the help of the bar graph the course where estimated requirement is least.
Solution:
RD Sharma Class 9 Solutions Chapter 23 Graphical Representation of Statistical Data Ex 23.2 12.2
The course where requirement is least is DCE.

Question 13.
The income and expenditure for 5 years of a family is given in the following data:
RD Sharma Class 9 Solutions Chapter 23 Graphical Representation of Statistical Data Ex 23.2 13.1
Represent the above data by a bar graph.
Solution:
RD Sharma Class 9 Solutions Chapter 23 Graphical Representation of Statistical Data Ex 23.2 13.2
RD Sharma Class 9 Solutions Chapter 23 Graphical Representation of Statistical Data Ex 23.2 13.3

Question 14.
The investment (in ten crores of rupees) of Life Insurance Corporation of India in different sectors are given below:
RD Sharma Class 9 Solutions Chapter 23 Graphical Representation of Statistical Data Ex 23.2 14.1
Represent the above data with the help of a bar graph.
Solution:
RD Sharma Class 9 Solutions Chapter 23 Graphical Representation of Statistical Data Ex 23.2 14.2
RD Sharma Class 9 Solutions Chapter 23 Graphical Representation of Statistical Data Ex 23.2 14.3

Question 15.
The following data gives the value (in crores of rupees) of the Indian export of cotton textiles for different years:
RD Sharma Class 9 Solutions Chapter 23 Graphical Representation of Statistical Data Ex 23.2 15.1
Represent the above data with the help of a bar graph. Indicate with the help of a bar graph the year in which the rate of increase in exports is maximum over the preceding year.
Solution:
RD Sharma Class 9 Solutions Chapter 23 Graphical Representation of Statistical Data Ex 23.2 15.2

Question 16.
The following table gives the quantity of good (in crore tonnes)
RD Sharma Class 9 Solutions Chapter 23 Graphical Representation of Statistical Data Ex 23.2 16.1
Represent this information with the help of a bar graph.
Explain through the bar graph if the quantity of goods carried by the Indian Railways in 1965-66 is more than double the quantity of goods carried in the year 1950-51.
Solution:
RD Sharma Class 9 Solutions Chapter 23 Graphical Representation of Statistical Data Ex 23.2 16.2

Question 17.
The production of oil (in lakh tonnes) in some of the refineries in India during 1982 was given below:
RD Sharma Class 9 Solutions Chapter 23 Graphical Representation of Statistical Data Ex 23.2 17.1
Construct a bar graph to represent the above data so that the bars are drawn horizontally.
Solution:
RD Sharma Class 9 Solutions Chapter 23 Graphical Representation of Statistical Data Ex 23.2 17.2
RD Sharma Class 9 Solutions Chapter 23 Graphical Representation of Statistical Data Ex 23.2 17.3

Question 18.
The expenditure (in 10 crores of rupees) on health by the Government of India during the various five year plans is shown below:
RD Sharma Class 9 Solutions Chapter 23 Graphical Representation of Statistical Data Ex 23.2 18.1
Construct a bar graph to represent the above data.
Solution:
RD Sharma Class 9 Solutions Chapter 23 Graphical Representation of Statistical Data Ex 23.2 18.2

Hope given RD Sharma Class 9 Solutions Chapter 23 Graphical Representation of Statistical Data Ex 23.2 are helpful to complete your math homework.

If you have any doubts, please comment below. Learn Insta try to provide online math tutoring for you.

RD Sharma Class 9 Solutions Chapter 23 Graphical Representation of Statistical Data Ex 23.1

RD Sharma Class 9 Solutions Chapter 23 Graphical Representation of Statistical Data Ex 23.1

These Solutions are part of RD Sharma Class 9 Solutions. Here we have given RD Sharma Class 9 Solutions Chapter 23 Graphical Representation of Statistical Data Ex 23.1

Other Exercises

Question 1.
The following table shows the daily production of T.V. sets in an industry for 7 days of a week:
RD Sharma Class 9 Solutions Chapter 23 Graphical Representation of Statistical Data Ex 23.1 1.1
Represent the above information by a pictograph.
Solution:
RD Sharma Class 9 Solutions Chapter 23 Graphical Representation of Statistical Data Ex 23.1 1.2
RD Sharma Class 9 Solutions Chapter 23 Graphical Representation of Statistical Data Ex 23.1 1.3
RD Sharma Class 9 Solutions Chapter 23 Graphical Representation of Statistical Data Ex 23.1 1.4

Question 2.
The following table shows the number of Maruti cars sold by five dealers in a particular month:
RD Sharma Class 9 Solutions Chapter 23 Graphical Representation of Statistical Data Ex 23.1 2.1
Represent the above information by a pictograph.
Solution:
RD Sharma Class 9 Solutions Chapter 23 Graphical Representation of Statistical Data Ex 23.1 2.2

Question 3.
The population of Delhi State in different census years is as given below:
RD Sharma Class 9 Solutions Chapter 23 Graphical Representation of Statistical Data Ex 23.1 3.1
Represent the above information with the help of a bar graph.
Solution:
RD Sharma Class 9 Solutions Chapter 23 Graphical Representation of Statistical Data Ex 23.1 3.2

Question 4.
Read the bar graph shown in Figure and answer the following questions:
RD Sharma Class 9 Solutions Chapter 23 Graphical Representation of Statistical Data Ex 23.1 4.1
(i) What is the information given by the bar graph?
(ii) How many tickets of Assam State Lottery were sold by the agent?
(iii) Of which state, were the maximum number of tickets sold?
(iv) State whether true or false.
The maximum number of tickets sold is three times the minimum number of tickets sold.
(v) Of which state were the minimum number of tickets sold?
Solution:
(i) Sale of lottery tickets if different states.
(ii) 40 tickets of Assam state lottery were sold.
(iii) Maximum number of lottery tickets were sold of Haryana state.
(iv) Maximum tickets were 100 and minimum = 20 which are not three time. False.
(v) Minimum Lottery tickets of 10 Rajasthan will sold.

Question 5.
Study the bar graph representing the number of persons in various age groups in a town shown in figure. Observe the bar graph and answer the following questions:
(i) What is the percentage of the youngest age-group persons over those in the oldest age group?
(ii) What is the total population of the town?
(iii) What is the number of persons in the age-group 60-65?
(iv) How many persons are more in the age-group 10-15 than in the age group 30-35?
(v) What is the age-group of exactly 1200 persons living in the town?
(vi) What is the total number of persons living in the town in the age-group 50-55?
(vii) What is the total number of persons living in the town in the age-groups 10-15 and 60-65?
(viii) Whether the population in general increases, decreases or remains constant with the increase in the age-group.
RD Sharma Class 9 Solutions Chapter 23 Graphical Representation of Statistical Data Ex 23.1 5.1
Solution:
(i) Youngest age group = 300 and oldest age group = 1400
RD Sharma Class 9 Solutions Chapter 23 Graphical Representation of Statistical Data Ex 23.1 5.2
(ii) Total population = 1400 + 1200 + 1100 + 1000 + 900 + 800 + 300 – 6700
(iii) In age group of 60-65, number of persons = 800
(iv) Difference of person in the age group 10-15 and of 30-35 = 1400 – 1100 = 300
(v) 1200 persons are in the age group 20-25
(vi) In age group 50-55 number of persons are 900
(vii) Total number of person of the age group 10-15 and
60-65 = 1400 + 800 = 2200
(viii)Population is decreasing with the age-group.

Question 6.
Read the bar graph shown in figure and answer the following questions:
(i) What is the information given by the bar graph?
(ii) What was the number of commercial banks in 1977?
(iii) What is the ratio of the number of commercial banks in 1969 to that in 1980?
(iv) State whether true or false:
The number of commercial banks in 1983 is less than double the number of commercial banks in 1969.
RD Sharma Class 9 Solutions Chapter 23 Graphical Representation of Statistical Data Ex 23.1 6.1
Solution:
(i) The information is number of commercial banks in India during same years.
(ii) In 1977, commercial banks were 130.
(iii) Ratio of banks in 1969 to 1980 = 90 : 150 = 3:5
(iv) Number of banks in 1983 = 230 and number of banks in 1969 = 90
∴ Number of banks in 1983 is less than double the number of banks in 1969 – False.

Question 7.
Given below is the bar graph indicating the marks obtained out of 50 in mathematics paper by 100 students. Read the bar graph and answer the following questions:
RD Sharma Class 9 Solutions Chapter 23 Graphical Representation of Statistical Data Ex 23.1 7.1
(i) It is decided to distribute work books on mathematics to the students obtaining less than 20 marks, giving one workbook to each of such students. If a work book costs T5, what sum is required to buy the work books?
(ii) Every student belonging to the highest mark group is entitled to get a prize of ? 10. How much amount of money is required for distributing the prize money?
(iii) Every student belonging to the lowest mark-group has to solve 5 problems per day. How many problems, in all, will be solved by the students of this group per day?
(iv) State whether true or false. .
(a) 17% students have obtained marks ranging from 40 to 49.
(b) 59 students have obtained marks ranging from 10 to 29.
(v) What is the number of students getting less than 20 marks?
(vi) What is the number of students getting more than 29 marks?
(vii) What is the number of students getting marks between 9 and 40?
(viii)What is the number of students belonging to the highest mark group?
(ix) What is the number of students obtaining more than 19 marks?
Solution:
(i) Students getting less than 20 marks = 27 + 12 = 39
Cost of 1 work book = ₹5
∴ Total cost = 39 x 5 = ₹195
(ii) No. of students getting highest mark group = 17
∴ Amount paid at the rate of Rs. 10 to each = 10 x 17 = Rs. 170
(iii) Lowest mark group = 27
∴ Total number of problems given = 27 x 5 = 135
(iv) (a) True (b) False
(v) No. of students getting less then 20 marks = 27 + 12 = 39
(vi) Students getting more than 29 marks = 24 + 17 = 41
(vii) Students getting marks between 9 and 40 = 12 + 20 + 24 = 56
(viii) Students to the highest mark group = 17
(ix) Students setting more than 19 marks = 20 + 24 + 17 = 61

Question 8.
Read the following bar graph and answer the following questions:
(i) What is the information given by the bar graph?
(ii) State each of the following whether true or false.
(a) The number of government companies in 1957 is that of 1982 is 1 : 9.
(b) The number of government companies have decreased over the year 1957 to 1983.
RD Sharma Class 9 Solutions Chapter 23 Graphical Representation of Statistical Data Ex 23.1 8.1
Solution:
(i) Number of government companies in India during some years.
(ii) (a) False (b) False
(a) 50 : 400 = 1:8 and (b) companies are increasing not decreasing.

Question 9.
Read the following bar graph and answer the following questions:
RD Sharma Class 9 Solutions Chapter 23 Graphical Representation of Statistical Data Ex 23.1 9.1
(i) What information is given by the bar graph?
(ii) Which state is the largest producer of rice?
(iii) Which state is the largest producer of wheat?
(iv) Which state has total production of rice and wheat as its maximum?
(v) Which state has the total production of wheat and rice minimum?
Solution:
(i) Production of rice and wheat in different states of India.
(ii) West Bengal is the largest state of production of rice.
(iii) Largest producer of wheat is U.P.
(iv) Maximum production of wheat and rice is U.P.
(v) Minimum production of wheat and rice is Maharashtra.

Question 10.
The following bar graph represents the heights (in cm) of 50 students of Class XI of a particular school. Study the graph and answer the following questions:
RD Sharma Class 9 Solutions Chapter 23 Graphical Representation of Statistical Data Ex 23.1 10.1
(i) What percentage of the total number of students have their heights more than 149 cm?
(ii) How many students in the class are in the range of maximum height of the class?
(iii) The school wants to provide a particular type of tonic to each student below the height of 150 cm to improve his height. If the cost of the tonic for each student comes out to be Rs. 55, how much amount of money is required?
(iv) How many students are in the range of shortest height of the class?
(v) State whether true or false:
(a) There are 9 students in the class whose heights are in the range of 155-159 cm.
(b) Maximum height (in cm) of a student in the class is 17.
(c) There are 29 students in the class whose heights are in the range of 145-154 cm.
(d) Minimum height (in cm) of a student is the class is in the range of 140-144 cms.
(e) The number of students in the class having their heights less than 150 cm is 12.
(f) There are 14 students each of whom has height more than 154 cm.
Solution:
(i) No. of students having more than height of 149 cm = 17 + 9 + 5 = 31
Percentage = \(\frac { 31 }{ 50 }\) x 100 = 62%
(ii) No. of students in the range of maximum height = 5
(iii) No. of students below the height of 150 cm = 7 + 12 = 19
Cost of tonic for each student = ₹55
∴ Total cost = ₹55 x 19 = ₹1045
(iv) No. of students in the shortest height = 7
(v) (a) True
(b) False
(c) True
(d) True
(e) False
(f) True

Question 11.
Read the following bar graph and answer the following questions:
(i) What information is given by the bar graph?
(ii) What was the production of cement in the year 1980-81?
(iii) What is the minimum and maximum productions of cement and corresponding years?
RD Sharma Class 9 Solutions Chapter 23 Graphical Representation of Statistical Data Ex 23.1 11.1
Solution:
(i) Industrial production of cement in different years in India.
(ii) In the year 1980-81, the production was 186 lakh tonnes.
(iii) Minimum production was 30 lakh tonnes in 1950-51 and maximum production was 232 lakh tonnes in 1982-83.

Question 12.
The bar graph shown in the figure represents the circulation of newspapers in 10 languages. Study the bar graph and answer the following questions:
RD Sharma Class 9 Solutions Chapter 23 Graphical Representation of Statistical Data Ex 23.1 12.1
(i) What is the total number of newspapers published in Hindi, English, Urdu, Punjabi and Bengali?
(ii) What percent is the number of news papers published in Hindi of the total number of newspapers?
(iii) Find the excess of the number of newspapers published in English over those published in Urdu,
(iv) Name two pairs of languages which publish the same number of newspapers.
(v) State the languages in which the smallest number of newspapers are published.
(vi) State the language in which the largest number of newspapers are published.
(vii) State the language in whih the number of newspapers published is between 2500 and 3500.
(viii)State whether true or false:
(a) The number of newspapers published in Malayalam and Marathi together is- less than those published in English.
(b) The number of newspapers published in Telugu is more than those published in Tamil.
Solution:
(i) Total number of newspapers in Hindi, English, Urdu, Punjabi, and Bengali
= 3700 + 3400 + 700 + 200 + 1100 = 9100
RD Sharma Class 9 Solutions Chapter 23 Graphical Representation of Statistical Data Ex 23.1 12.2
(iii) Difference in English and Urdu = 3400 – 700 = 2700
(iv) Malayalam and Marathi, Bengali and Gujrati
(v) Punjabi (200)
(vi) Hindi (3700)
(vii) English (3400)
(viii)(a) True (b) False

Question 13.
Read the bar graph given in figure and answer the following questions:
(i) What information is given by the bar graph?
(ii) What was the crop-production if rice in 1970-71?
(iii) What is the difference between the maximum and minimum production of rice?
RD Sharma Class 9 Solutions Chapter 23 Graphical Representation of Statistical Data Ex 23.1 13.1
Solution:
(i) Production of rice in India in different years.
(ii) Crop production in 1970-71 was 42.5 lakh tonnes.
(iii) Differences in maximum and minimum production of rice = 55 – 22 lakh tonnes = 33 lakh tonnes

Question 14.
Read the bar graph given in figure and answer the following questions:
RD Sharma Class 9 Solutions Chapter 23 Graphical Representation of Statistical Data Ex 23.1 14.1
(i) What information does it give?
(ii) in which part the expenditure on education is maximum in 1980?
(iii) In which part the expenditure has gone up from 1980 to 1990?
(iv) In which part the gap between 1980 and 1990 is maximum?
Solution:
(i) Public expenditure on education by vertices sub-continents in 1980 and 1990.
(ii) Maximum expenditure on education in 1980 was in Africa.
(iii) The expenditure from 1980 to 1990 was gone up in East Africa.
(iv) Maximum gap between 1980 and 1990 was in Africa.

Question 15.
Read the bar graph given in the figure and answer the following questions:
RD Sharma Class 9 Solutions Chapter 23 Graphical Representation of Statistical Data Ex 23.1 15.1
(i) What information is given by the bar graph?
(ii) In whicli years the areas under the sugarcane crop were the maximum and the minimum?
(iii) State whether true or false:
The area under the sugarcane crop in the year 1982-83 is three times that of the year 1950-51.
Solution:
(i) Areas under sugarcane crop during different years in India.
(ii) Maximum sugarcane crop was in 1982-83 and minimum in 1950-51.
(iii) False.

Question 16.
Read the bar graph given in the figure and answer the following questions:
RD Sharma Class 9 Solutions Chapter 23 Graphical Representation of Statistical Data Ex 23.1 16.1
(i) What information is given by the bar graph?
(ii) What was the expenditure on health and family planning in the year 1982-83?
(iii) In which year is the increase in expenditure maximum over the expenditure in previous year? What is the maximum increase?
Solution:
(i) Expenditure on health and family planning sixth five year plan in India.
(ii) Expenditure during 1982-83 was 700 crore of rupees.
(iii) Maximum increase in 1984-85 was them in previous year and difference 10.2 – 8 = 220 crores.

Question 17.
Read the bar graph given in the figure and answer the following questions:
(i) What is the information given by the bar graph?
(ii) What is the number of families having 6 members?
(iii) How many members per family are there in the maximum number of families? Also tell the number of such families.
(iv) What are the number of members per family for which the number of families are equal? Also, tell the number of such families?
RD Sharma Class 9 Solutions Chapter 23 Graphical Representation of Statistical Data Ex 23.1 17.1
Solution:
(i) Number of families with different number of members in a locality.
(ii) Number of families having 6 members are 50.
(iii) Maximum number of families are of 3 members family and there are 120.
(iv) Number of families having 9 members and having 10 members are equal and each is 5.

Question 18.
Read the bar graph given in the figure and answer the following questions:
RD Sharma Class 9 Solutions Chapter 23 Graphical Representation of Statistical Data Ex 23.1 18.1
(i) What information is given by the bar graph?
(ii) Which Doordarshan centre covers maximum area? Also tell the covered area.
(iii) What is the difference between the areas covered by the centres at Delhi and Bombay?
(iv) Which Doordarshan centres are in U.P. State? What are the areas covered by them?
Solution:
(i) Coverage of some Doordarshan centres of India.
(ii) Doordarshan kender Kolkata covers maximum area which is 36000 sq. km.
(iii) Difference of areas covered by Delhi and Bombay centres = 32000 – 18000 = 14000 sq. km.
(iv) In U.R Doordarshan centres are Kanpur (32000 sq. km) and Lucknow (25000 sq. km).


Hope given RD Sharma Class 9 Solutions Chapter 23 Graphical Representation of Statistical Data Ex 23.1 are helpful to complete your math homework.

If you have any doubts, please comment below. Learn Insta try to provide online math tutoring for you.

RD Sharma Class 9 Solutions Chapter 22 Tabular Representation of Statistical Data MCQS

RD Sharma Class 9 Solutions Chapter 22 Tabular Representation of Statistical Data MCQS

These Solutions are part of RD Sharma Class 9 Solutions. Here we have given RD Sharma Class 9 Solutions Chapter 22 Tabular Representation of Statistical Data MCQS

Other Exercises

Mark the correct alternative in each of the following:
Question 1.
Tally marks are used to find
(a) class intervals
(b) range
(c) frequency
(d) upper limits
Solution:
Frequency (c)

Question 2.
The difference between the highest and lowest values of the observations is called
(a) frequency
(b) mean
(c) range
(d) class intervals
Solution:
range (c)

Question 3.
The difference between the upper limit and the lower class limits is called
(a) mid-points
(b) class size
(c) frequency
(d) mean
Solution:
class size (b)

Question 4.
In the class intervals 10-20, 20-30, 20 is taken in
(a) the interval 10-20
(b) the interval 20-30
(c) both interval 10-20, 20-30
(d) none of the intervals
Solution:
the interval 20-30 (b)

Question 5.
In a frequency distribution, the mid value of a class is 15 and the class intervals is 4. The lower limit of the class is
(a) 10
(b) 12
(c) 13
(d) 14
Solution:
Mid value = 15 and class interval is 4
∴ Lower limit = 15 – \(\frac { 4 }{ 5 }\) = 15 – 2 = 13 (c)

Question 6.
The mid-value of a class interval is 42. If the class size is 10, then the upper and lower limits of the class are
(a) 47 and 37
(b) 37 and 47
(c) 37.5 and 47.5
(d) 47.5 and 37.5
Solution:
Mid value = 42 and class size =10
∴ Upper limit = 42 + \(\frac { 10 }{ 2 }\) = 42 + 5 = 47
and lower limit = 42 – \(\frac { 10 }{ 2 }\) = 42 – 5 = 37
Upper class limit and lower class limits are 47, 37 (a)

Question 7.
The number of times a particular item occurs in a given data is called its
(a) variation
(b) frequency
(c) cumulative frequency
(d) class-size
Solution:
frequency (b)

Question 8.
The width of each of nine classes in a frequency distribution is 2.5 and the lower class boundary of the lowest class 10.6. Then the upper class boundary of the highest class is
(a) 35.6
(b) 33.1
(c) 30.6
(d) 28.1
Solution:
Width of each class = 2.5
No. of classes = 9
Lower class boundary of the lowest class = 10.6
∴ Upper class limit of highest class = 10.6 + 9 x 2.5
= 10.6 + 22.5 = 33.1 (b)

Question 9.
The following marks were obtained by the students in a test:
81, 72, 90, 90, 86, 85, 92, 70, 71, 83, 89, 95, 85, 79, 62
The range of the marks is
(a) 9
(b) 17
(c) 27
(d) 33
Solution:
Marks are 81, 72, 90, 90, 86, 85, 92, 70, 71, 83, 89, 95, 85, 79, 62
Here highest marks = 95
and lowest marks = 62
∴ Range = highest marks – lowest marks = 95 – 62 = 33 (d)

Question 10.
Tallys are usually marked in a bunch of
(a) 3
(b) 4
(c) 5
(d) 6
Solution:
4 i.e. IIII (b)

Question 11.
Let l be the lower class limit of a class- interval in a frequency distribution and m be the mid-point of the class. Then, the upper class limit of the class is
RD Sharma Class 9 Solutions Chapter 22 Tabular Representation of Statistical Data MCQS 11.1
Solution:
l is the lower class limit of a class interval
m is the mid point of the class
m = \(\frac { u+l }{ 2 }\)
⇒ 2m = u+ l ⇒ u = 2m – l
Then, upper class limit = 2 m – l (c)

Hope given RD Sharma Class 9 Solutions Chapter 22 Tabular Representation of Statistical Data MCQS are helpful to complete your math homework.

If you have any doubts, please comment below. Learn Insta try to provide online math tutoring for you.

RD Sharma Class 9 Solutions Chapter 22 Tabular Representation of Statistical Data Ex 22.2

RD Sharma Class 9 Solutions Chapter 22 Tabular Representation of Statistical Data Ex 22.2

These Solutions are part of RD Sharma Class 9 Solutions. Here we have given RD Sharma Class 9 Solutions Chapter 22 Tabular Representation of Statistical Data Ex 22.2

Other Exercises

Question 1.
Define cumulative frequency distribution.
Solution:
Cumulative frequency : In a discrete frequency distribution, the cumulative frequency of a particular value of the variable is the total of all the frequencies of the values of the variable which are less than or equal to the particular value.

Question 2.
Explain the difference between a frequency distribution and a cumulative frequency distribution.
Solution:
The number of times an observation occurs in the given data, is called frequency of the
observation while a cumulative frequency of a particular value of the variable is the total of all the frequencies of the values of the variable which are less than or equal to the particular value.

Question 3.
The marks scored by 55 students in a test are given below:
RD Sharma Class 9 Solutions Chapter 22 Tabular Representation of Statistical Data Ex 22.2 3.1
Prepare a cumulative frequency table.
Solution:
Cumulative frequency table is given below:
RD Sharma Class 9 Solutions Chapter 22 Tabular Representation of Statistical Data Ex 22.2 3.2

Question 4.
Following are the ages of 360 patients getting medical treatment in a hospital on a day:
RD Sharma Class 9 Solutions Chapter 22 Tabular Representation of Statistical Data Ex 22.2 4.1
Construct a cumulative frequency distribution.
Solution:
Cumulative frequency distribution table (less than) is given below:
RD Sharma Class 9 Solutions Chapter 22 Tabular Representation of Statistical Data Ex 22.2 4.2

Question 5.
The water bills (in rupees) of 32 houses in a certain street for the period 1.1.98 to 31.3.98 are given below:
56, 43, 32, 38, 56, 24, 68, 85, 52, 47, 35, 58, 63, 74, 27, 84, 69, 35, 44, 75, 55, 30, 54, 65, 45, 67, 95, 72, 43, 65, 35, 59.
Tabulate the data and present the data as a cumulative frequency table using 70-79 as one of the class intervals.
Solution:
Highest bill = 95 Lowest bill = 24
Range = 95 – 24 = 71
Cumulative frequency table is given below:
RD Sharma Class 9 Solutions Chapter 22 Tabular Representation of Statistical Data Ex 22.2 5.1

Question 6.
The number of books in different shelves of a library are as follows:
30, 32, 28, 24, 20, 25, 38, 37, 40, 45, 16, 20, 19, 24, 27, 30, 32, 34, 35, 42, 27, 28, 19, 34,
38, 39, 42, 29, 24, 27, 22, 29, 31, 19, 27, 25, 28, 23, 24, 32, 34, 18, 27, 25, 37, 31, 24, 23,
43, 32, 28, 31, 24, 23, 26, 36, 32, 29, 28, 21.
Prepare a cumulative frequency distribution table using 45-49 as the last class interval.
Solution:
Greatest number = 43
Lowest number =16
Range = 43 – 16 = 27
Cumulative frequency table is given below:
RD Sharma Class 9 Solutions Chapter 22 Tabular Representation of Statistical Data Ex 22.2 6.1

Question 7.
Given below are the cumulative frequencies showing the weights of 685 students of a school. Prepare a frequency distribution table.
RD Sharma Class 9 Solutions Chapter 22 Tabular Representation of Statistical Data Ex 22.2 7.1
Solution:
The frequency table of the given cumulative frequency is given below:
RD Sharma Class 9 Solutions Chapter 22 Tabular Representation of Statistical Data Ex 22.2 7.2

Question 8.
The following cumulative frequency distribution table shows the daily electricity consumption (in kW) of 40 factories in an industrial state:
RD Sharma Class 9 Solutions Chapter 22 Tabular Representation of Statistical Data Ex 22.2 8.1
(i) Represent this as a frequency distribution table.
(ii) Prepare a cumulative frequency table.
Solution:
(i) The frequency distribution table is given below:
RD Sharma Class 9 Solutions Chapter 22 Tabular Representation of Statistical Data Ex 22.2 8.2
(ii) Now cumulative frequency table (more then)
RD Sharma Class 9 Solutions Chapter 22 Tabular Representation of Statistical Data Ex 22.2 8.3

Question 9.
Given below is a cumulative frequency distribution table showing the ages of people living in a locality.
RD Sharma Class 9 Solutions Chapter 22 Tabular Representation of Statistical Data Ex 22.2 9.1
Prepare a frequency distribution table.
Solution:
Frequency distribution table is given below:
RD Sharma Class 9 Solutions Chapter 22 Tabular Representation of Statistical Data Ex 22.2 9.2

Hope given RD Sharma Class 9 Solutions Chapter 22 Tabular Representation of Statistical Data Ex 22.2 are helpful to complete your math homework.

If you have any doubts, please comment below. Learn Insta try to provide online math tutoring for you.

RD Sharma Class 9 Solutions Chapter 21 Surface Areas and Volume of a Sphere MCQS

RD Sharma Class 9 Solutions Chapter 21 Surface Areas and Volume of a Sphere MCQS

These Solutions are part of RD Sharma Class 9 Solutions. Here we have given RD Sharma Class 9 Solutions Chapter 21 Surface Areas and Volume of a Sphere MCQS

Other Exercises

Mark the correct alternative in each of the following:
Question 1.
In a sphere, the number of faces is
(a) 1
(b) 2
(c) 3
(d) 4
Solution:
Number of faces of a sphere is 1 (a)

Question 2.
The total surface area of a hemisphere of radius r is
(a) πr2
(b) 2πr2
(c) 3πr2
(d) 4πr2
Solution:
Total surface area of a hemisphere is 37πr2 (c)

Question 3.
The ratio of the total surface area of a sphere and a hemisphere of same radius is
(a) 2 : 1
(b) 3 : 2
(c) 4 : 1
(d) 4 : 3
Solution:
Total surface area of a sphere = 4πr2
and total surface area of a hemisphere = 3m2
∴ Ratio 4πr2: 3πr2
= 4 : 3 (d)

Question 4.
A sphere and a cube are of the same height. The ratio of their volumes is
(a) 3 :4
(b) 21 : 11
(c) 4 : 3
(d) 11 : 21
Solution:
Let r be the height of a sphere and cube
RD Sharma Class 9 Solutions Chapter 21 Surface Areas and Volume of a Sphere MCQS 4.1

Question 5.
The largest sphere is cut off from a cube of side 6 cm. The volume of the sphere will be
(a) 27π cm3
(b) 36π cm3
(c) 108π cm3
(d) 12π cm3
Solution:
Side of cube = 6 cm
∴ Diameter of sphere cut off from it = 6 cm
RD Sharma Class 9 Solutions Chapter 21 Surface Areas and Volume of a Sphere MCQS 5.1

Question 6.
A cylmderical rod whose height is 8 times of its radius is melted and recast into spherical balls of same radius. The number of balls will be
(a) 4
(b) 3
(c) 6
(d) 8
Solution:
Let r be the radius of a cylindrical rod = r
Then its height (h) = 8r
Volume = πr2h = πr2 x 8r = 8πr3
Radius of spherical ball = r
RD Sharma Class 9 Solutions Chapter 21 Surface Areas and Volume of a Sphere MCQS 6.1

Question 7.
If the ratio of volumes of two spheres is 1 : 8, then the ratio of their surface areas is
(a) 1 : 2
(b) 1 : 4
(c) 1 : 8
(d) 1 : 16
Solution:
Let r1 and r2 be the radius of two spheres
RD Sharma Class 9 Solutions Chapter 21 Surface Areas and Volume of a Sphere MCQS 7.1

Question 8.
If the surface area of a sphere is 144π m2 then its volume (in. m3) is
(a) 288π
(b) 316π
(c) 300π
(d) 188π
Solution:
Surface area of a sphere = 144π m2
Let r be the radius, then
4πr2 = 144π
RD Sharma Class 9 Solutions Chapter 21 Surface Areas and Volume of a Sphere MCQS 8.1

Question 9.
If a solid sphere of radius 10 cm is moulded into 8 spherical solid balls of equal radius, then the surface area of each ball (in sq. cm) is
(a) 100π
(b) 75π
(c) 60π
(d) 50π
Solution:
Radius of a sphere (r) = 10 cm
RD Sharma Class 9 Solutions Chapter 21 Surface Areas and Volume of a Sphere MCQS 9.1

Question 10.
If a sphere is inscribed in a cube, then the ratio of the volume of the sphere to the volume of the cube is
(a) π : 2
(b) π : 3
(c) π : 4
(d) π : 6
Solution:
Let side of a cube = a
Then volume of cube = a3
The diameter of inscribed sphere = a
RD Sharma Class 9 Solutions Chapter 21 Surface Areas and Volume of a Sphere MCQS 10.1

Question 11.
If a solid sphere of radius r is melted and cast into the shape of a solid cone of height r, then the radius of the base of the cone is
(a) 2r
(b) 3r
(c) r
(d) 4r
Solution:
Radius of a sphere = r
RD Sharma Class 9 Solutions Chapter 21 Surface Areas and Volume of a Sphere MCQS 11.1

Question 12.
A sphere is placed inside a right circular cylinder so as to touch the top, base and lateral surface of the cylinder. If the radius of the sphere is r, then the volume of the cylinder is
RD Sharma Class 9 Solutions Chapter 21 Surface Areas and Volume of a Sphere MCQS 12.1
Solution:
Radius of sphere = r
RD Sharma Class 9 Solutions Chapter 21 Surface Areas and Volume of a Sphere MCQS 12.2

Question 13.
The ratio between the volume of a sphere and volume of a circumscribing right circular cylinder is
(a) 2 : 1
(b) 1 : 1
(c) 2 : 3
(d) 1 : 2
Solution:
Let r be the radius of the sphere, then 4
Volume = \(\frac { 4 }{ 3 }\)πr3
Diameter of circumscribed cylinder = 2r
∴ Radius = r
and height (h) = 2r
RD Sharma Class 9 Solutions Chapter 21 Surface Areas and Volume of a Sphere MCQS 13.1

Question 14.
A cone and a hemisphere have equal bases and equal volumes the ratio of their heights is
(a) 1 : 2
(b) 2 : 1
(c) 4 : 1
(d) \(\sqrt { 2 } \) : 1
Solution:
Let radius of hemisphere and a cone be r
RD Sharma Class 9 Solutions Chapter 21 Surface Areas and Volume of a Sphere MCQS 14.1

Question 15.
A cone, a hemisphere and a cylinder stand on equal bases and have the same height. The ratio of their volumes is
(a) 1 : 2 : 3
(b) 2 : 1 : 3
(c) 2 : 3 : 1
(d) 3 : 2 : 1
Solution:
∵ Bases of a cone, hemisphere and a cylinder are same
Let radius of each = r
and height of each = r
RD Sharma Class 9 Solutions Chapter 21 Surface Areas and Volume of a Sphere MCQS 15.1

Hope given RD Sharma Class 9 Solutions Chapter 21 Surface Areas and Volume of a Sphere MCQS are helpful to complete your math homework.

If you have any doubts, please comment below. Learn Insta try to provide online math tutoring for you.

RD Sharma Class 9 Solutions Chapter 21 Surface Areas and Volume of a Sphere VSAQS

RD Sharma Class 9 Solutions Chapter 21 Surface Areas and Volume of a Sphere VSAQS

These Solutions are part of RD Sharma Class 9 Solutions. Here we have given RD Sharma Class 9 Solutions Chapter 21 Surface Areas and Volume of a Sphere VSAQS

Other Exercises

Question 1.
Find the surface area of a sphere of radius 14 cm.
Solution:
Radius of a sphere (r) = 14 cm
∴ Surface area = 4πr2 = 4 x \(\frac { 22 }{ 7 }\) x 14 x 14 cm2
= 2464 cm3

Question 2.
Find the total surface afea of a hemisphere of radius 10 cm.
Solution:
Radius of hemisphere (r) = 10 cm
∴ Total surface area = 3πr2
RD Sharma Class 9 Solutions Chapter 21 Surface Areas and Volume of a Sphere VSAQS 2.1

Question 3.
Find the radius of a sphere whose surface area is 154 cm2.
Solution:
Surface area of a sphere = 154 cm2
RD Sharma Class 9 Solutions Chapter 21 Surface Areas and Volume of a Sphere VSAQS 3.1

Question 4.
The hollow sphere, in which the circus motor cyclist performs his stunts, has a diameter of 7 m. Find the area available to the motor cyclist for riding.
Solution:
Diameter of hollow sphere = 7 m
RD Sharma Class 9 Solutions Chapter 21 Surface Areas and Volume of a Sphere VSAQS 4.1

Question 5.
Find the volume of a sphere whose surface area is 154 cm2.
Solution:
Surface area of a sphere = 154 cm2
RD Sharma Class 9 Solutions Chapter 21 Surface Areas and Volume of a Sphere VSAQS 5.1

Question 6.
How many spherical bullets can be made out of a solid cube of lead whose edge measures 44 cm, each bullet being 4 cm in diameter?
Solution:
Edge of a solid cube = 44 cm
∴ Volume = a2 = (44)2 cm2
= 44 × 44 × 44 cm3
Diameter of a spherical bullet = 4 cm
RD Sharma Class 9 Solutions Chapter 21 Surface Areas and Volume of a Sphere VSAQS 6.1

Question 7.
If a sphere of radius 2r has the same volume as that of a cone with circular base of radius r, then find the height of the cone.
Solution:
Radius of a sphere (R) = 2r
RD Sharma Class 9 Solutions Chapter 21 Surface Areas and Volume of a Sphere VSAQS 7.1

Question 8.
If a hollow sphere of intefnal and external diameters 4 cm and 8 cm respectively melted into a cone of base diameter 8 cm, then find the height of the cone.
Solution:
Internal diameter of a hollow sphere = 4cm
∴ Internal radius = \(\frac { 4 }{ 2 }\) = 2 cm
Similarly the outer radius (R) = \(\frac { 8 }{ 2 }\) = 4 cm
∴ Volume of melted used in hollow sphere
RD Sharma Class 9 Solutions Chapter 21 Surface Areas and Volume of a Sphere VSAQS 8.1
RD Sharma Class 9 Solutions Chapter 21 Surface Areas and Volume of a Sphere VSAQS 8.2

Question 9.
The surface area of a sphere of radius 5 cm is five times the area of the curved surface of a cone of radius 4 cm. Find the height of the cone.
Solution:
Radius of a sphere (r) = 5 cm
∴ Surface area = 4πr2
= 4π x 5 x 5 = 100π cm2
Radius of cone (r1) = 4 cm
RD Sharma Class 9 Solutions Chapter 21 Surface Areas and Volume of a Sphere VSAQS 9.1

Question 10.
If a sphere is inscribed in a cube, find the ratio of the volume of cube to the volume of the sphere.
Solution:
Let edge of a cube = a
Then its volume = a3
∵ A sphere is inscribed in the cube
∴ Diameter of sphere = a
RD Sharma Class 9 Solutions Chapter 21 Surface Areas and Volume of a Sphere VSAQS 10.1

Hope given RD Sharma Class 9 Solutions Chapter 21 Surface Areas and Volume of a Sphere VSAQS are helpful to complete your math homework.

If you have any doubts, please comment below. Learn Insta try to provide online math tutoring for you.

RD Sharma Class 9 Solutions Chapter 21 Surface Areas and Volume of a Sphere Ex 21.2

RD Sharma Class 9 Solutions Chapter 21 Surface Areas and Volume of a Sphere Ex 21.2

These Solutions are part of RD Sharma Class 9 Solutions. Here we have given RD Sharma Class 9 Solutions Chapter 21 Surface Areas and Volume of a Sphere Ex 21.2

Other Exercises

Question 1.
Find the volume of a sphere whose radius is
(i) 2 cm
(ii) 3.5 cm
(iii) 10.5 cm
Solution:
(i) Radius of sphere (r) = 2 cm
RD Sharma Class 9 Solutions Chapter 21 Surface Areas and Volume of a Sphere Ex 21.2 1.1

Question 2.
Find the volume of a sphere whose diameter is,
(i) 14 cm
(ii) 3.5 dm
(iii) 2.1 m
Solution:
(i) Diameter of a sphere = 14 cm
RD Sharma Class 9 Solutions Chapter 21 Surface Areas and Volume of a Sphere Ex 21.2 2.1
RD Sharma Class 9 Solutions Chapter 21 Surface Areas and Volume of a Sphere Ex 21.2 2.2

Question 3.
A hemspherical tank has inner radius of 2.8 m. Find its capacity in litres.
Solution:
Radius of hemispherical tank (r) = 2.8 m
RD Sharma Class 9 Solutions Chapter 21 Surface Areas and Volume of a Sphere Ex 21.2 3.1

Question 4.
A hemispherical bowl is made of steel 0.25 cm thick. The inside radius of the bowl is 5 cm. Find the volume of steel used in making the bowl.
Solution:
Thickness of steel = 0.25 cm = \(\frac { 1 }{ 4 }\)cm
Inside radius of the hemispherical bowl (r) = 5 cm
∴ Outer radius (R) = 5 + 0.25 = 5.25 cm
∴ Volume of the steel used = \(\frac { 1 }{ 4 }\)π(R3 – r3)
RD Sharma Class 9 Solutions Chapter 21 Surface Areas and Volume of a Sphere Ex 21.2 4.1

Question 5.
How many bullets can be made out of a cube of lead, whose edge measures 22 cm, each bullet being 2 cm in diameter?
Solution:
Edge of cube (r) = 22 cm
∴ Volume = a3 = (22)3 cm3
= 22 x 22 x 22 = 10648 cm3
Diameter of a bullet = 2 cm
RD Sharma Class 9 Solutions Chapter 21 Surface Areas and Volume of a Sphere Ex 21.2 5.1

Question 6.
A shopkeeper has one laddoo of radius 5 cm. With the same material how many laddoos of radius 2.5 cm can be made?
Solution:
Radius of bigger laddoo (R) = 5 cm
RD Sharma Class 9 Solutions Chapter 21 Surface Areas and Volume of a Sphere Ex 21.2 6.1

Question 7.
A spherical ball of lead 3 cm in diameter is melted and recast into three spherical balls. It the diameters of two balls be \(\frac { 3 }{ 2 }\) cm and 2 cm, find the diameter of the third ball.
Solution:
Diameter of a spherical ball of lead = 3 cm
RD Sharma Class 9 Solutions Chapter 21 Surface Areas and Volume of a Sphere Ex 21.2 7.1
RD Sharma Class 9 Solutions Chapter 21 Surface Areas and Volume of a Sphere Ex 21.2 7.2
RD Sharma Class 9 Solutions Chapter 21 Surface Areas and Volume of a Sphere Ex 21.2 7.3

Question 8.
A sphere of radius 5 cm is immersed in water filled in a cylinder, the level of water rises \(\frac { 5 }{ 3 }\) cm. Find the radius of the cylinder.
Solution:
Radius of sphere (r1) = 5 cm
RD Sharma Class 9 Solutions Chapter 21 Surface Areas and Volume of a Sphere Ex 21.2 8.1
Level of water rises in the cylinder after immersing the sphere in it
∴ Height of water level = \(\frac { 5 }{ 3 }\) cm
Let r be radius of the cylinder, then Volume of water = Volume of the sphere
RD Sharma Class 9 Solutions Chapter 21 Surface Areas and Volume of a Sphere Ex 21.2 8.2

Question 9.
If the radius of a sphere is doubled, what is the ratio of the volumes of the first sphere to that of the second sphere?
Solution:
Let r2 be the radius of the given sphere
then volume = \(\frac { 4 }{ 3 }\) πr3
By doubling the radius the radius of the new sphere = 2r
RD Sharma Class 9 Solutions Chapter 21 Surface Areas and Volume of a Sphere Ex 21.2 9.1

Question 10.
A vessel in the form of a hemispherical bowl is full of water. Its contents are emptied in a right circular cylinder. The internal radii of the bowl and the cylinder are 3.5 cm and 7 cm respectively. Find the height to which the water will rise in the cylinder.
Solution:
Radius of hemispherical bowl (r) = 3.5 cm
RD Sharma Class 9 Solutions Chapter 21 Surface Areas and Volume of a Sphere Ex 21.2 10.1

Question 11.
A cylinder whose height is two thirds of its diameter, has the same volume as a sphere of radius 4 cm. Calculate the radius of the base of the cylinder.
Solution:
Radius of a sphere (r) = 4 cm
RD Sharma Class 9 Solutions Chapter 21 Surface Areas and Volume of a Sphere Ex 21.2 11.1
RD Sharma Class 9 Solutions Chapter 21 Surface Areas and Volume of a Sphere Ex 21.2 11.2

Question 12.
A vessel in the form of a hemispherical bowl is full of water. The contents are emptied into a cylinder. The internal radii of the bowl and cylinder are respectively 6 cm and 4 cm. Find the height of water in the cylinder.
Solution:
Radius of hemispherical bowl (r) = 6 cm
RD Sharma Class 9 Solutions Chapter 21 Surface Areas and Volume of a Sphere Ex 21.2 12.1

Question 13.
The diameter of a copper sphere is 18 cm. The sphere is melted and is drawn into a long wire of uniform circular cross-section. If the length of the wire is 108 m, find its diameter.
Solution:
Diameter of a copper sphere = 18 cm
RD Sharma Class 9 Solutions Chapter 21 Surface Areas and Volume of a Sphere Ex 21.2 13.1

Question 14.
The diameter of a sphere is 6 cm. It is melted and drawn into a wire of diameter 0.2 cm. Find the length of the wire.
Solution:
Diameter of a sphere = 6 cm
RD Sharma Class 9 Solutions Chapter 21 Surface Areas and Volume of a Sphere Ex 21.2 14.1
RD Sharma Class 9 Solutions Chapter 21 Surface Areas and Volume of a Sphere Ex 21.2 14.2

Question 15.
The radius of the internal and external surfaces of a hollow spherical shell are 3 cm and 5 cm respectively. If it is melted and recast into a solid cylinder of height 2 \(\frac { 2 }{ 3 }\) cm. Find the diameter of the cylinder.
Solution:
Internal radius of the hollow spherical shell (r) = 3 cm
and external radius (R) = 5 cm
RD Sharma Class 9 Solutions Chapter 21 Surface Areas and Volume of a Sphere Ex 21.2 15.1

Question 16.
A hemisphere of lead of radius 7 cm is cast into a right circular cone of height 49 cm. Find the radius of the base.
Solution:
Radius of hemisphere (r) = 7 cm
RD Sharma Class 9 Solutions Chapter 21 Surface Areas and Volume of a Sphere Ex 21.2 16.1

Question 17.
A hollow sphere of internal and external radius 2 cm and 4 cm respectively is melted into a cone of base radius 4 cm. Find the height and slant height of the cone.
Solution:
Internal radius of a hollow sphere (r) = 2 cm
and external radius (R) = 4 cm
∴ Volume of the metal used
RD Sharma Class 9 Solutions Chapter 21 Surface Areas and Volume of a Sphere Ex 21.2 17.1

Question 18.
A metallic sphere of radius 10.5 cm is melted and thus recast into small cones each of radius 3.5 cm and height 3 cm. Find how many cones are obtained.
Solution:
Radius of a metallic sphere (R) = 10.5 cm
RD Sharma Class 9 Solutions Chapter 21 Surface Areas and Volume of a Sphere Ex 21.2 18.1

Question 19.
A cone and a hemisphere have equal bases and equal volumes. Find the ratio Of their heights.
Solution:
Let r be the radius and h be the height of the cone, hemisphere
RD Sharma Class 9 Solutions Chapter 21 Surface Areas and Volume of a Sphere Ex 21.2 19.1

Question 20.
The largest sphere is carved out of a cube of side 10.5 cm. Find the volume of the sphere.
Solution:
By carving a largest sphere out of the cube, the diameter of the sphere = 10.5
RD Sharma Class 9 Solutions Chapter 21 Surface Areas and Volume of a Sphere Ex 21.2 20.1

Question 21.
A cube, of side 4 cm, contains a sphere touching its sides. Find the volume of the gap in between.
Solution:
Side of cube = 4 cm
∴ Volume = (side)3 = 4x4x4 = 64 cm3
Diameter of the largest sphere touching its sides = 4 cm
RD Sharma Class 9 Solutions Chapter 21 Surface Areas and Volume of a Sphere Ex 21.2 21.1

Question 22.
A hemispherical tank is made up of an iron sheet 1 cm thick. If the inner radius is 1m, then find the volume of the iron used to make the tank. (NCERT)
Solution:
Thickness of hemispherical tank = 1 cm
Inner radius (r) = 1 m = 100 cm
RD Sharma Class 9 Solutions Chapter 21 Surface Areas and Volume of a Sphere Ex 21.2 22.1
RD Sharma Class 9 Solutions Chapter 21 Surface Areas and Volume of a Sphere Ex 21.2 22.2

Question 23.
A capsule of medicine is in the shape of a sphere of diameter 3.5 mm. How much medicine (in mm3) is needed to fill this capsule? (NCERT)
Solution:
Diameter of a medicine spherical capsule = 3.5 mm
RD Sharma Class 9 Solutions Chapter 21 Surface Areas and Volume of a Sphere Ex 21.2 23.1

Question 24.
The diameter of the moon is approximately one fourth of the diameter of the earth. What fraction of the volume of the earth is the volume of the moon? (NCERT)
Solution:
RD Sharma Class 9 Solutions Chapter 21 Surface Areas and Volume of a Sphere Ex 21.2 24.1
RD Sharma Class 9 Solutions Chapter 21 Surface Areas and Volume of a Sphere Ex 21.2 24.2

Question 25.
A cone and a hemisphere have equal bases and equal volumes. Find the ratio in their heights.
Solution:
Let r be the radius of cone and hemisphere and let h be the height of the cone then
RD Sharma Class 9 Solutions Chapter 21 Surface Areas and Volume of a Sphere Ex 21.2 25.1

Question 26.
A cylindrical tub of radius 16 cm contains water to a depth of 30 cm. A spherical iron ball is dropped into the tub and thus level of water is raised by 9 cm. What is the radius of the ball?
Solution:
Radius of cylinderical tub (r) = 16 cm
Height of water in it (h) = 30 cm
RD Sharma Class 9 Solutions Chapter 21 Surface Areas and Volume of a Sphere Ex 21.2 26.1

Question 27.
A cylinder of radius 12 cm contains water to a depth of 20 cm. A spherical iron ball is dropped into the cylinder and thus the level of water is raised by 6.75 cm. Find the radius of the ball. (Use π = 22/7).
Solution:
Radius of cylinder (r) = 12 cm
Depth of water in it (h) = 20 cm
By dropping a ball, the water level rose by 6.75 cm
RD Sharma Class 9 Solutions Chapter 21 Surface Areas and Volume of a Sphere Ex 21.2 27.1

Question 28.
A cylindrical jar of radius 6 cm contains oil. Iron spheres each of radius 1.5 cm are immersed in the oil. How many spheres are necessary to raise the level of the oil by two centimetres?
Solution:
Radius of cylinderical jar (r) = 6 cm
Level of oil in it (h) = 2 cm
RD Sharma Class 9 Solutions Chapter 21 Surface Areas and Volume of a Sphere Ex 21.2 28.1

Question 29.
A measuring jar of internal diameter 10 cm is partially filled with water. Four equal spherical balls of diameter 2 cm eacfy are dropped in it and they sink down in water completely. What will be the change in the level of water in the jar?
Solution:
Diameter of measuring jar = 10 cm
RD Sharma Class 9 Solutions Chapter 21 Surface Areas and Volume of a Sphere Ex 21.2 29.1
Now after swing the ball in the water of jar Let volume of water raised, by h cm
RD Sharma Class 9 Solutions Chapter 21 Surface Areas and Volume of a Sphere Ex 21.2 29.2

Question 30.
A cone, a hemisphere and a cylinder stand on equal bases and have the same height. Show that their volumes are in the ratio 1 : 2:3.
Solution:
∵ Bases and heights of a cones hemisphere and a cylinder are equal
Let r be the radius and h be their heights
RD Sharma Class 9 Solutions Chapter 21 Surface Areas and Volume of a Sphere Ex 21.2 30.1

Question 31.
A cylinderical tub of radius 12 cm contains water to a depth of 20 cm. A spherical form ball is dropped into the tub and thus the level of water is raised by 6.75 cm. What is the radius of the ball?
Solution:
Radius of the cylinderical tub (r) = 12 cm
Depth of water in it (h) = 20 cm
By dropping a spherical ball in it, the water raised by 6.75 cm
RD Sharma Class 9 Solutions Chapter 21 Surface Areas and Volume of a Sphere Ex 21.2 31.1

Question 32.
A sphere, a cylinder and a cone have the same diameter. The height of the cylinder and also the cone are equal to the diameter of the sphere. Find the ratio of their volumes.
Solution:
Diameter of a sphere, cylinder and a cone are equal
Let each as diameter = 2r
Then radius of each = r
Height of cylinder = diameter = 2r
and height of cone = 2r
Now volume of sphere = \(\frac { 4 }{ 3 }\)πr3
Volume of cylinder = πr2h
RD Sharma Class 9 Solutions Chapter 21 Surface Areas and Volume of a Sphere Ex 21.2 32.1

Hope given RD Sharma Class 9 Solutions Chapter 21 Surface Areas and Volume of a Sphere Ex 21.2 are helpful to complete your math homework.

If you have any doubts, please comment below. Learn Insta try to provide online math tutoring for you.