RD Sharma Class 9 Solutions Chapter 22 Tabular Representation of Statistical Data Ex 22.2
These Solutions are part of RD Sharma Class 9 Solutions. Here we have given RD Sharma Class 9 Solutions Chapter 22 Tabular Representation of Statistical Data Ex 22.2
Other Exercises
- RD Sharma Class 9 Solutions Chapter 22 Tabular Representation of Statistical Data Ex 22.1
- RD Sharma Class 9 Solutions Chapter 22 Tabular Representation of Statistical Data Ex 22.2
- RD Sharma Class 9 Solutions Chapter 22 Tabular Representation of Statistical Data MCQS
Question 1.
Define cumulative frequency distribution.
Solution:
Cumulative frequency : In a discrete frequency distribution, the cumulative frequency of a particular value of the variable is the total of all the frequencies of the values of the variable which are less than or equal to the particular value.
Question 2.
Explain the difference between a frequency distribution and a cumulative frequency distribution.
Solution:
The number of times an observation occurs in the given data, is called frequency of the
observation while a cumulative frequency of a particular value of the variable is the total of all the frequencies of the values of the variable which are less than or equal to the particular value.
Question 3.
The marks scored by 55 students in a test are given below:
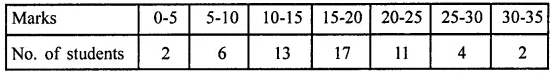
Prepare a cumulative frequency table.
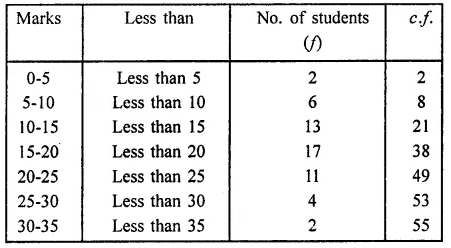
Solution:
Cumulative frequency table is given below:
Question 4.
Following are the ages of 360 patients getting medical treatment in a hospital on a day:
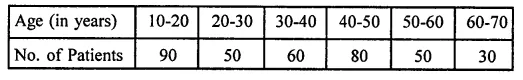
Construct a cumulative frequency distribution.
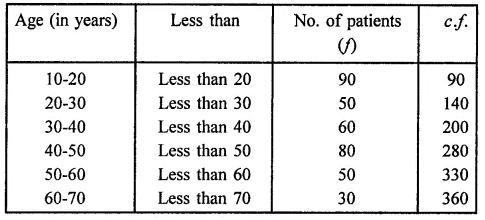
Solution:
Cumulative frequency distribution table (less than) is given below:
Question 5.
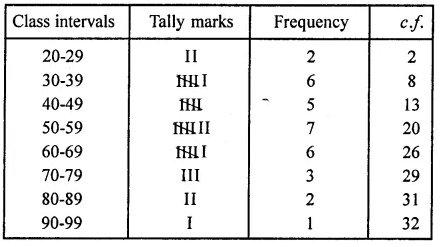
The water bills (in rupees) of 32 houses in a certain street for the period 1.1.98 to 31.3.98 are given below:
56, 43, 32, 38, 56, 24, 68, 85, 52, 47, 35, 58, 63, 74, 27, 84, 69, 35, 44, 75, 55, 30, 54, 65, 45, 67, 95, 72, 43, 65, 35, 59.
Tabulate the data and present the data as a cumulative frequency table using 70-79 as one of the class intervals.
Solution:
Highest bill = 95 Lowest bill = 24
Range = 95 – 24 = 71
Cumulative frequency table is given below:
Question 6.
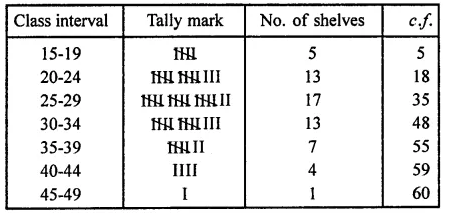
The number of books in different shelves of a library are as follows:
30, 32, 28, 24, 20, 25, 38, 37, 40, 45, 16, 20, 19, 24, 27, 30, 32, 34, 35, 42, 27, 28, 19, 34,
38, 39, 42, 29, 24, 27, 22, 29, 31, 19, 27, 25, 28, 23, 24, 32, 34, 18, 27, 25, 37, 31, 24, 23,
43, 32, 28, 31, 24, 23, 26, 36, 32, 29, 28, 21.
Prepare a cumulative frequency distribution table using 45-49 as the last class interval.
Solution:
Greatest number = 43
Lowest number =16
Range = 43 – 16 = 27
Cumulative frequency table is given below:
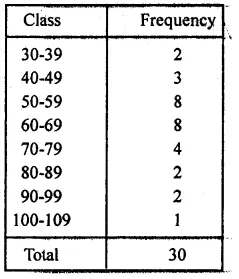
Question 7.
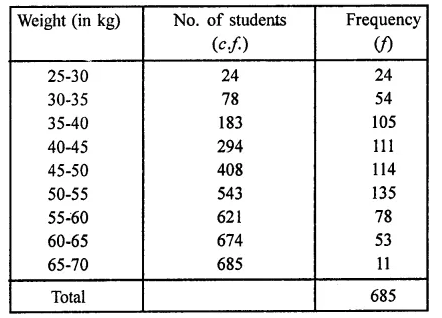
Given below are the cumulative frequencies showing the weights of 685 students of a school. Prepare a frequency distribution table.
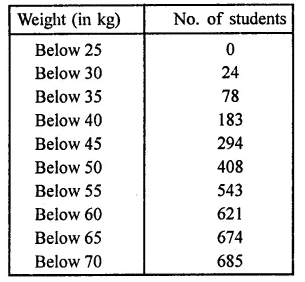
Solution:
The frequency table of the given cumulative frequency is given below:
Question 8.
The following cumulative frequency distribution table shows the daily electricity consumption (in kW) of 40 factories in an industrial state:
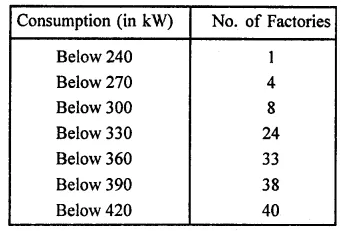
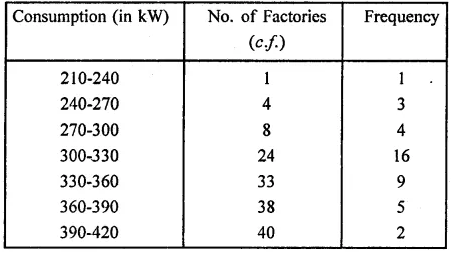
(i) Represent this as a frequency distribution table.
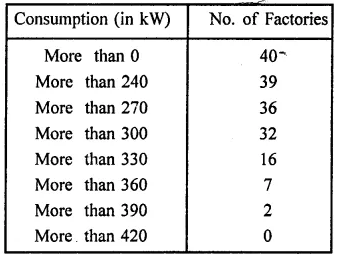
(ii) Prepare a cumulative frequency table.
Solution:
(i) The frequency distribution table is given below:
(ii) Now cumulative frequency table (more then)
Question 9.
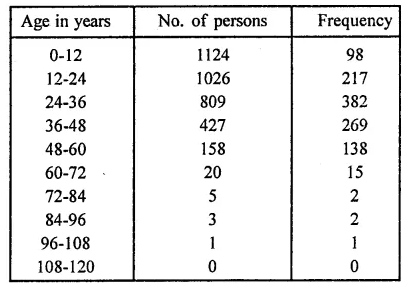
Given below is a cumulative frequency distribution table showing the ages of people living in a locality.
Prepare a frequency distribution table.
Solution:
Frequency distribution table is given below:
Hope given RD Sharma Class 9 Solutions Chapter 22 Tabular Representation of Statistical Data Ex 22.2 are helpful to complete your math homework.
If you have any doubts, please comment below. Learn Insta try to provide online math tutoring for you.