Senescene

Learninsta presents the core concepts of Biology with high-quality research papers and topical review articles.

Senescene

Plant life comprises some sequential events, viz: germination, juvenile stage, maturation, old age and death. Old age is called senescence in plants. Senescence refers to all collective, progressive and deteriorative processes which ultimately lead to complete loss of organization and function. Unlike animals, plants continuously form new organs and older organs undergo a highly regulated senescence program to maximize nutrient export.

1. Types of Senescence

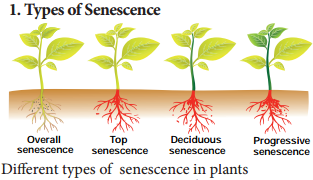
Leopold (1961) has recognised four types of senescence:

  • Overall Senescence
  • Top Senescence
  • Deciduous Senescence
  • Progressive Senescence

Overall Senescence:

This kind of senescence occurs in annual plants when entire plant gets affected and dies. Example: Wheat and Soybean. It also occurs in few perennials also. Example: Agave and Bamboo.

Top Senescence:

It occurs in aerial parts of plants. It is common in perennials, underground and root system remains viable. Example: Banana and Gladiolus.

Deciduous Senescence:

It is common in deciduous plants and occurs only in leaves of plants, bulk of the stem and root system remains alive. Example: Elm and Maple.

Progressive Senescence:

This kind of senescence is gradual. First it occurs in old leaves followed by new leaves then stem and finally root system. It is common in annuals (Figure 15.13).
Senescene img 1

2. Physiology of Senescence

  • Cells undergo changes in structure.
  • Vacuole of the cell acts as lysosome and secretes hydrolytic enzymes.
  • The starch content is decreased in the cells.
  • Photosynthesis is reduced due to loss of chlorophyll accompanied by synthesis and accumulation of anthocyanin pigments, therefore the leaf becomes red.
  • There is a marked decrease in protein content in the senescing organ.
  • RNA content of the leaf particularly rRNA level is decreased in the cells due to increased activity of the enzyme RNAase.
  • DNA molecules in senescencing leaves degenerate by the increased activity of enzyme DNAase.

3. Factors Affecting Senescence:

  • ABA and ethylene accelerate senescence while auxin and cytokinin retard senescence.
  • Nitrogen deficiency increases senescence whereas nitrogen supply retards senescence.
  • High temperature accelerates senescence but low temperature retards senescence.
  • Senescence is rapid in dark than in light.
  • Water stress leads to accumulation of ABA leading to senescence.

4. Programmed Cell Death (PCD)

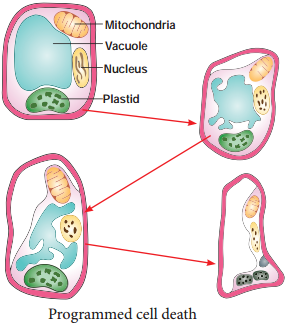
Senescence is controlled by plants own genetic programme and death of the plant or plant part consequent to senescence is called Programmed Cell Death. In short senescence of an individual cell is called PCD. The proteolytic enzymes involving PCD in plants are phytaspases and in animals are caspases. The nutrients and other substrates from senescing cells and tissues are remobilized and reallocated to other parts of the plant that survives.

The protoplasts of developing xylem vessels and tracheids die and disappear at maturity to make them functionally efficient to conduct water for transport. In aquatic plants, aerenchyma is normally formed in different parts of the plant such as roots and stems which encloses large air spaces that are created through PCD. In the development of unisexual flowers, male and female flowers are present in earlier stages, but only one of these two completes its development while other aborts through PCD (Figure 15.14).
Senescene img 2

5. Abscission

Abscission is a physiological process of shedding of organs like leaves, flowers, fruits and seeds from the parent plant body. When these parts are removed the plant seals of its vascular system to prevent loss of water and nutrients. Final stage of senescence is abscission.

In temperate regions all the leaves of deciduous plants fall in autumn and give rise to naked appearance, then the new leaves are developed in the subsequent spring season. But in evergreen plants there is gradual abscission of leaves, the older leaves fall while new leaves are developed continuously throughout the year.

6. Morphological and Anatomical Changes During Abscission

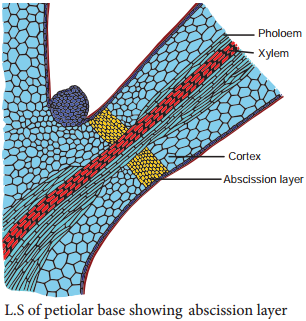
Leaf abscission takes place at the base of petiole which is marked internally by a distinct zone of few layers of thin walled cells arranged transversely. This zone is called abscission zone or abscission layer. An abscission layer is greenish-grey in colour and is formed by rows of cells of 2 to 15 cells thick.

The cells of abscission layer separate due to dissolution of middle lamella and primary wall of cells by the activity of enzymes pectinase and cellulase resulting in loosening of cells. Tyloses are also formed blocking the conducting vessels. Degrading of chlorophyll occur leading to the change in the colour of leaves, leaf detachment from the plant and leaf fall. After abscission, outer layer of cells becomes suberized by the development of periderm (Figure 15.15).
Senescene img 3

7. Hormones Influencing Abscission

All naturally occurring hormones influence the process of abscission. Auxins and cytokinins retard abscission, while abscisic acid (ABA) and ethylene induce it.

8. Significance of Abscission

  • Abscission separates dead parts of the plant, like old leaves and ripe fruits.
  • It helps in dispersal of fruits and continuing the life cycle of the plant.
  • Abscission of leaves in deciduous plants helps in water conservation during summer.
  • In lower plants, shedding of vegetative parts like gemmae or plantlets help in vegetative reproduction.
Seed Germination and Dormancy

Learninsta presents the core concepts of Biology with high-quality research papers and topical review articles.

Seed Germination and Dormancy

I. Seed Germination

The activation and growth of embryo from seed into seedling during favourable conditions is called seed germination.

1. Types of Germination

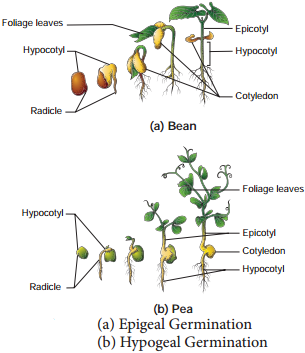
There are two methods of seed germination. Epigeal and hypogeal.

(i) Epigeal and Hypogeal

During epigeal germination cotyledons are pushed out of the soil. This happens due to the elongation of the hypocotyl. Example: Castor and Bean.

(ii) Hypogeal Germination

During hypogeal germination cotyledons remain below the soil due to rapid elongation of epicotyls (Figure 15.12). Example: Maize, Pea.
Seed Germination and Dormancy img 1

2. Factors Affecting Germination

Seed germination is directly affected by external and internal factors:

(i) External Factors

a. Water:
It activates the enzymes which digest the complex reserve foods of the seed. If the water content of the seed goes below a critical level, seeds fail to germinate.

b. Temperature:
Seeds fails to germinate at very low and high temperature. The optimum temperature is 25°C to 35°C for most tropic species.

c. Oxygen:
It is necessary for germination. Since aerobic respiration is a physiological requirement for germination most will germinate well in air containing 20% oxygen.

d. Light:
There are many seeds which respond to light for germination and these seeds said to be photoblastic.

e. Soil Conditions:
Germination of seed in its natural habit is influenced by soil conditions such as water holding capacity, mineral composition and aeration of the soil.

(ii) Internal Factors

a. Maturity of Embryo:
The seeds of some plants, when shed will contain immature embryo. Such seeds germinate only after maturation of embryo.

b. Viability:
Usually seeds remain viable or living only for a particular period. Viability of seeds range from a few days (Example: Oxalis) to more than hundred years. Maximum viability (1000 years) has been recorded in lotus seeds. Seeds germinate only within the period of viability.

c. Dormancy:
Seeds of many plants are dormant at the time of shedding. A detailed treatment is given below.

II. Seed Dormancy

The seeds of most plants germinate under favourable environmental conditions but some seeds do not germinate when suitable conditions like water, oxygen and favourable temperature are not available. Germination of such seeds may be delayed for days, months or years.

The condition of a seed when it fails to germinate even in suitable environmental condition is called seed dormancy. There are two main reasons for the development of dormancy: Imposed dormancy and innate dormancy. Imposed dormancy is due to low moisture and low temperature. Innate dormancy is related to the properties of seed itself.

1. Factors Causing Dormancy of Seeds:

  • Hard, tough seed coat causes barrier effect as impermeability of water, gas and restriction of the expansion of embryo prevents seed germination.
  • Many species of seeds produce imperfectly developed embryos called rudimentary embryos which promotes dormancy.
  • Lack of specific light requirement leads to seed dormancy.
  • A range of temperatures either higher or lower cause dormancy.
  • The presence of inhibitors like phenolic compounds which inhibits seed germination cause dormancy.

2. Methods of Breaking Dormancy:

The dormancy of seeds can be broken by different methods. These are:

(i) Scarification:
Mechanical and chemical treatments like cutting or chipping of hard tough seed coat and use of organic solvents to remove waxy or fatty compounds are called as Scarification.

(ii) Impaction:
In some seeds water and oxygen are unable to penetrate micropyle due to blockage by cork cells. These seeds are shaken vigorously to remove the plug which is called Impaction.

(iii) Stratification:
Seeds of rosaceous plants (Apple, Plum, Peach and Cherry) will not germinate until they have been exposed to well aerated, moist condition under low temperature (0°C to 10°C) for weeks to months. Such treatment is called Stratification.

(iv) Alternating Temperatures:
Germination of some seeds is strongly promoted by alternating daily temperatures. An alternation of low and high temperature improves the germination of seeds.

(v) Light:
The dormancy of photoblastic seeds can be broken by exposing them to red light.

Vernalization

Learninsta presents the core concepts of Biology with high-quality research papers and topical review articles.

Vernalization

Besides photoperiod certain plants require a low temperature exposure in their earlier stages for flowering. Many species of biennials and perennials are induced to flower by low temperature exposure (0°C to 5°C). This process is called Vernalization. The term Vernalization was first used by T. D. Lysenko (1938).

1. Mechanism of Vernalization:

Two main theories to explain the mechanism of vernalization are:

  1. Hypothesis of Phasic Development
  2. Hypothesis of Hormonal Involvement

1. Hypothesis of Phasic Development

According to Lysenko, development of an annual seed plant consists of two phases. First phase is thermostage, which is vegetative phase requiring low temperature and suitable moisture. Next phase is photo stage which requires high temperature for synthesis of florigen (flowering hormone).

2. Hypothesis of Hormonal Involvement

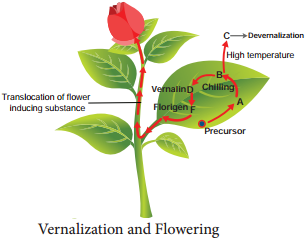
According to Purvis (1961), formation of a substance A from its precursor, is converted into B after chilling. The substance B is unstable. At suitable temperature B is converted into stable compound D called Vernalin. Vernalin is converted to F (Florigen). Florigen induces flower formation. At high temperature B is converted to C and devernalization occurs (Figure 15.11).
Vernalization img 1

Technique of Vernalization:

The seeds are first soaked in water and allowed to germinate at 10°C to 120°C. Then seeds are transferred to low temperature (3°C to 5°C) from few days to 30 days. Germinated seeds after this treatment are allowed to dry and then sown. The plants will show quick flowering when compared to untreated control plants.

3. Devernalization

Reversal of the effect of vernalization is called devernalization.

4. Practical Applications

  • Vernalization shortens the vegetative period and induces the plant to flower earlier.
  • It increases the cold resistance of the plants.
  • It increases the resistance of plants to fungal disease.
  • Plant breeding can be accelerated.

Vernalization (from Latin vernus, “of the spring”) is the induction of a plant’s flowering process by exposure to the prolonged cold of winter, or by an artificial equivalent. This ensures that reproductive development and seed production occurs in spring and winters, rather than in autumn.

Plants often flower in the spring, so, in practical terms, vernalization is the promotion of flowering in response to prolonged low temperatures. This response evolved in plants that adapted to regions where the winters are harsh and the growing season relatively short.

Some examples include beets, onions, winter wheat, cabbage, and turnips. In order to produce flowers and seeds, these plants have to go through a process called vernalization. Vernalization simply means that the plant has to experience a period of cold before it can produce flowers.

In laboratory experiments vernalization occurs at constant temperatures in growth rooms set to between 0 and around 15°C. But real winter temperatures are not constant, and daily fluctuations outside during day and night often exceed the difference in seasonal average temperatures.

Vernalization (from Latin vernus, “of the spring”) is the induction of a plant’s flowering process by exposure to the prolonged cold of winter, or by an artificial equivalent. Typical vernalization temperatures are between 1 and 7 degrees Celsius (34 and 45 degrees Fahrenheit).

Vernalization, the artificial exposure of plants (or seeds) to low temperatures in order to stimulate flowering or to enhance seed production. By partially germinating the seed and then chilling it to 0° C (32° F) until spring, it is possible to cause winter wheat to produce a crop in the same year.
Vernalization is the acquisition of a plant’s ability to flower in the spring by exposure to the prolonged cold of winter, or by an artificial equivalent. After vernalization, plants have acquired the ability to flower, but they may require additional seasonal cues or weeks of growth before they will actually flower.

The site that perceives the cold stimulus can be different in different plants. It could be the apical meristem in the shoots, the germinating seed or the vegetative parts such as leaves.

Many types of plants have vernalization requirements. Many fruit trees, including apples and peaches, require minimum chilling times each winter to produce a good crop. Too warm winters can damage the trees health or even kill them over time.

Winter wheat requires vernalization, a process where plants exposed to cold temperatures experience physiological changes. With wheat this means the plants will not flower until they have been exposed to cold temperatures. Varieties with a higher vernalization requirement need more exposure to cold temperatures.

In absence of cold treatment, accumulation of ent-kaurenoic acid in shoot tip occurs. Cold treatment followed by exposure to high temperatures convert it into GA9, which stimulates flowering response in plants. Thus, gibberellins can substitute the vernalization.

Gibberellins affect several reproductive processes in plants. They stimulate flowering, particularly in long-day plants. In addition, gibberellins substitute for the low temperature that biennials require before they begin flowering (vernalisation).

There are plants for which flowering is either quantitatively or qualitatively dependent on exposure to low temperature, this phenomenon is termed vernalisation. Vernalisation refers specially to the promotion of flowering by a period of low temperature.

Plant Growth Regulators

Learninsta presents the core concepts of Biology with high-quality research papers and topical review articles.

Plant Growth Regulators

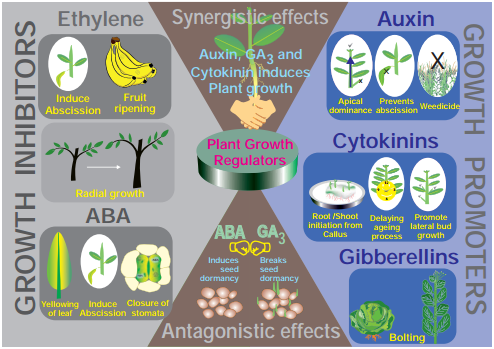
Plant Growth Regulators (chemical messenger) are defined as organic substances which are synthesized in minute quantities in one part of the plant body and transported to another part where they influence specific physiological processes. Five major groups of hormones viz., auxins, gibberellins, cytokinins, ethylene and abscisic acid are presently known to coordinate and regulate growth and development in plants.

The term phytohormones is implied to those chemical substances which are synthesized by plants and thus, naturally occurring. On the other hand, there are several manufactured chemicals which often resemble the hormones in physiological action and even in molecular structure. Recently, another two groups, the brassinosteroids and polyamines were also known to behave like hormones.

1. Plant Growth Regulators – Classification

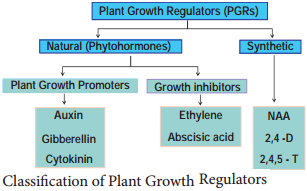
Plant Growth Regulators are classified as natural and synthetic based on their source and a detailed flow diagram is given in Figure 15.7.
Plant Growth Regulators img 1

2. Characteristics of Phytohormones

  • Usually produced in tips of roots, stems and leaves.
  • Transfer of hormones from one place to another takes part through conductive systems.
  • They are required in trace quantities.
  • All hormones are organic in nature.
  • There are no specialized cells or organs for their secretion.
  • They are capable of influencing physiological activities leading to promotion, inhibition and modification of growth.

3. Synergistic and Antagonistic Effects

(i) Synergistic Effects:

The effect of one or more substance in such a way that both promote each others activity. Example: Activity of auxin and gibberellins or cytokinins.

(ii) Antagonistic Effects:

The effect of two substances in such a way that they have opposite effects on the same process. One accelerates and other inhibits. Example: ABA and gibberellins during seed or bud dormancy. ABA induces dormancy and gibberellins break it.

Auxins

1. Discovery

During 1880, Charles Darwin noted the unilateral growth and curvature of Canary grass (Phalaris canariensis) coleoptile to light. The term auxin (Greek: Auxin – to Grow) was first used by F.W. Went in 1926 using Oats (Avena) coleoptile and isolated the auxin. F.W. Went in 1928 collected auxin in agar jelly. Kogl and Haugen Smith (1931) isolated Auxin from human urine, and called it as Auxin A.

Later on in 1934, similar active substances was isolated from corn grain oil and was named as Auxin B. Kogl etal., (1934) found heteroauxin in the plant and chemically called it as Indole Acetic Acid (IAA)

2. Occurrence

Auxin is generally produced by the growing tips of the stem and root, from where they migrate to the region of the action.

3. Types of Auxin

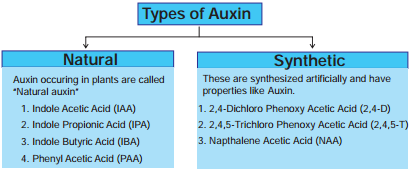
Auxins are divided into two categories Natural auxins and Synthetic auxins.
Plant Growth Regulators img 2

(i) Free Auxin

They move out of tissues as they are easily diffusible. Example: IAA.

(ii) Bound Auxin

They are not diffusible. Example: IAA.

4. Precursor

The amino acid Tryptophan is the precursor of IAA and zinc is required for its synthesis.

5. Chemical Structure

Auxin has similar chemical structure of IAA.

6. Transport in Plants

Auxin is polar in transport. It includes basipetal and acropetal transport. Basipetal means transport through phloem from shoot to root and acropetal means transport through xylem from root to shoot.

7. Bioassay (Avena Curvature Test/Went Experiment)

Bioassay means testing of substances for their activity in causing a growth response in a living plant or its part.

The procedure involves the following steps:

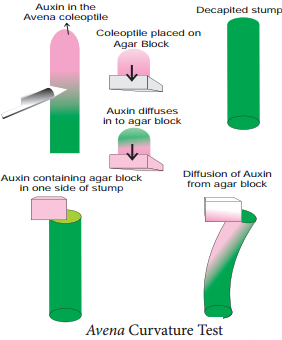
When the Avena seedlings have attained a height of 15 to 30 mm, about 1mm of the coleoptile tip is removed. This apical part is the source of natural auxin. The tip is now placed on agar blocks for few hours. During this period, the auxin diffuses out of these tips into the agar. The auxin containing agar block is now placed on one side of the decapitated stump of Avena coleoptile.

The auxin from the agar blocks diffuses down through coleoptile along the side to which the auxin agar block is placed. An agar block without auxin is placed on another decapitated coleoptile. Within an hour, the coleoptiles with auxin agar block bends on the opposite side where the agar block is placed.

This curvature can be measured (Figure 15.8).
Plant Growth Regulators img 3

8. Physiological Effects

  • They promote cell elongation in stem and coleoptile.
  • At higher concentrations auxins inhibit the elongation of roots but extermely lower concentrations promotes growth of root.
  • Suppression of growth in lateral bud by apical bud due to auxin produced by apical bud is termed as apical dominance.
  • Auxin prevents abscission.
  • It is used to eradicate weeds. Example: 2,4-D and 2, 4, 5-T.
  • Synthetic auxins are used in the formation of seedless fruits (Parthenocarpic fruit).
  • It is used to break the dormancy in seeds.

Gibberellins

1. Discovery

The effect of gibberellins had been known in Japan since early 1800 where certain rice plants were found to suffer from ‘Bakanae’ or foolish seedling disease. This disease was found by Kurosawa (1926) to be caused by a fungus Gibberella fujikuroi. The active substance was separated from fungus and named as gibberellin by Yabuta (1935).

These are more than 100 gibberellins reported from both fungi and higher plants. They are noted as GA1, GA2, GA3 and so on. GA3 is the first discovered gibberellin. In 1938, Yabuta and Sumiki isolated gibberellin in crystalline form. In 1955, Brain etal., gave the name gibberellic acid. In 1961, Cross etal., established its structure.

2. Occurrence

The major site of gibberellin production in plants is parts like embryo, roots and young leaves near the tip. Immature seeds are rich in gibberellins.

3. Precursors

The gibberellins are chemically related to terpenoids (natural rubber, carotenoids and steroids) formed by 5-C precursor, an Isoprenoid unit called Iso Pentenyl Pyrophosphate (IPP) through a number of intermediates. The primary precursor is acetate.

4. Chemical Structure

All gibberellins have gibbane ring structure.

5. Transport in Plants

The transport of gibberellins in plants is nonpolar. Gibberellins are translocated through phloem and also occur in xylem due to lateral movement between vascular bundles.

6. Bioassay (Dwarf Pea Assay)

Seeds of dwarf pea are allowed to germinate till the formation of the coleoptile. GA solution is applied to some seedlings. Others are kept under control. Epicotyl length is measured and as such, GA stimulating epicotyl growth can be seen.

7. Physiological Effects

  • It produces extraordinary elongation of stem caused by cell division and cell elongation.
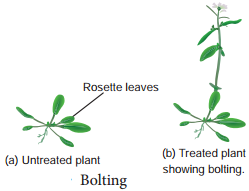
  • Rosette plants (genetic dwarfim) exhibit excessive internodal growth when they are treated with gibberellins.
  • This sudden elongation of stem followed by flowering by the application of gibberellin is called bolting (Figure 15.9).
  • Gibberellin breaks dormancy in potato tubers.
  • Many biennials usually flower during second year of their growth. For flowering in the first year it self these plants should be treated with gibberellins.
  • Formation of seedless fruits without fertilization is induced by gibberellins Example: Seedless tomato, apple and cucumber.
  • Promotes elongation of inter-node in sugarcane without decreasing sugar content.
  • Promotion of flowering in long day plants even under short day conditions.
  • It stimulates the seed germination.

Plant Growth Regulators img 4

Cytokinins (Cytos – cell, Kinesis – Division)

1. Discovery

The presence of cell division inducing substances in plants was first demonstrated by Haberlandt in 1913 in Coconut milk (liquid endosperm of coconut) which contains cell division inducing substances.

In 1954, Skoog and Miller discovered that autoclaved DNA from herring sperm stimulated cell division in tobacco pith cells. They called this cell division inducing principle as kinetin (chemical structure: 6-Furfuryl Amino Acid).

This does not occur in plants. In 1963, Letham introduced the term cytokinin. In 1964, Letham and Miller isolated and identified a new cytokinin called Zeatin from unripe grains of maize. The most widely occurring cytokinin in plants is Iso Pentenyl adenine (IPA).

2. Occurrence

Cytokinin is formed in root apex, shoot apex, buds and young fruits.

3. Precursor

Cytokinins are derivatives of the purine adenine.

4. Bioassay (Neem Cotyledon Assay)

Neem cotyledons are measured and placed in cytokinin solution as well as in ordinary water. Enlargement of cotyledons is an indication of cytokinin activity.

5. Transport in Plants

The distribution of cytokinin in plants is not as wide as those of auxin and gibberellins but found mostly in roots. Cytokinins appear to be translocated through xylem.

6. Physiological Effect

  • Cytokinin promotes cell division in the presence of auxin (IAA).
  • Cytokinin induces cell enlargement associated with IAA and gibberellins
  • Cytokinin can break the dormancy of certain light-sensitive seeds like tobacco and induces seed germination.
  • Cytokinin promotes the growth of lateral bud in the presence of apical bud.
  • Application of cytokinin delays the process of aging by nutrient mobilization. It is known as Richmond Lang effect.
  • Cytokinin
  • Increases rate protein synthesis
  • Induces the formation of inter-fascicular cambium
  • Overcomes apical dominance
  • Induces formation of new leaves, chloroplast and lateral shoots

Plants accumulate solutes very actively with the help of cytokinins.

Ethylene (Gaseous Phytohormone)

Almost all plant tissues produce ethylene gas in minute quantities.

1. Discovery

In 1924, Denny found that ethylene stimulates the ripening of lemons. In 1934, R. Gane found that ripe bananas contain abundant ethylene. In 1935, Cocken et al., identified ethylene as a natural plant hormone.
Plant Growth Regulators img 5

2. Occurance

Maximum synthesis occurs during climacteric ripening of fruits (see Box info) and tissues undergoing senescence. It is formed in almost all plant parts like roots, leaves, flowers, fruits and seeds.

3. Transport in Plants

Ethylene can easily diffuse inside the plant through intercellular spaces.

4. Precursor

It is a derivative of amino acid methionine, linolenic acid and fumaric acid.

5. Bioassay (Gas Chromatography)

Ethylene can be measured by gas chromatography. This technique helps in the detection of exact amount of ethylene from different plant tissues like lemon and orange.

6. Physiological Effects

  • Ethylene stimulates respiration and ripening in fruits.
  • It breaks the dormancy of buds, seeds and storage organs.
  • It stimulates formation of abscission zone in leaves, flowers and fruits. This makes the leaves to shed prematurely.
  • Inhibition of stem elongation (shortening the internode).
  • Growth of lateral roots and root hairs. This increases the absorption surface of the plant roots.
  • Ethylene normally reduces flowering in plants except in Pine apple and Mango.

Abscisic Acid (ABA) (Stress Phyto Hormone)

1. Discovery

In 1963, the hormone was first isolated by Addicott et al., from young cotton bolls and named as Abscission II. Eagles and Wareing during 1963-64 isolated a dormancy inducing substance from leaves of Betula and called it as dormin. In 1965, it was found by Cornsforth et al., that both dormin and abscission are chemically same compounds and called Abscisic Acid (ABA).

2. Occurrence

This hormone is found abundantly inside the chloroplast of green cells.

3. Precursors

The hormone is formed from mevalonic acid pathway or xanthophylls.

4. Transport in Plants

Abscisic acid is transported to all parts of the plant through diffsion as well as through phloem and xylem.

5. Chemical Structure

It has carotenoid structure.

6. Bioassay (Rice Coleoptile)

The inhibition of IAA induces straight growth of rice seedling coleoptiles.

7. Physiological Effects

  • It helps in reducing transpiration rate by closing stomata.
  • ABA is a powerful growth inhibitor. It causes 50% inhibition of growth in Oat coleoptile.
  • It induces bud and seed dormancy.
  • It promotes the abscission of leaves, flowers and fruits by forming abscission layers.
  • ABA plays an important role in plants during water stress and during drought conditions. It results in loss of turgor and closure of stomata.
  • In Cannabis sativa, induces male flower formation on female plants.
  • It promotes sprouting in storage organs like Potato.
  • It inhibits the shoot growth and promotes growth of root system. This character protect the plants from water stress. Hence, ABA is called as stress hormone.

Characteristics of Growth

Learninsta presents the core concepts of Biology with high-quality research papers and topical review articles.

Characteristics of Growth

  1. Growth increases in protoplasm at cellular level.
  2. Stem and roots are indeterminate in growth due to continuous cell division and is called open form of growth.
  3. The primary growth of the plant is due to the activity of apical meristem where, new cells are added to root and shoot apex causing linear growth of plant body.
  4. The secondary vascular cambium and cork cambium add new cells to cause increase in girth.
  5. Leaves, flowers and fruits are limited in growth or determinate or closed form growth.
  6. Monocarpic annual plants produce flowers only once during lifetime and dies. Example: Paddy and Bean
  7. Monocarpic perennials produce flowers only once during life time but the plants survive for many years. Example: Bamboo.
  8. Polycarpic perennials produce flowers every year during life time. Example: Coconut.

Kinetics of Growth

It is an analysis of the motion of cells or expansion.

1. Stages in Growth Rate

The total period from initial to the final stage of growth is called the grand period of growth. The total growth is plotted against time and ‘S’ shaped sigmoid curve (Grand period curve) is obtained. It consists of four phases. They are:

  1. Lag Phase
  2. Log Phase
  3. Decelerating Phase
  4. Maturation Phase

1. Lag Phase

In this phase new cells are formed from pre-existing cells slowly. It is found in the tip of the stem, root and branches. It is the initial stage of growth. In other words, growth starts from this period.

2. Log Phase or Exponential Growth

Here, the newly formed cell increases in size rapidly by deposition of cell wall material. Growth rate is maximum and reaches top because of cell division and physiological processes are quite fast. The volume of protoplasm also increases. It results in rapid growth and causes elongation of internode in the stem.

3. Decelerating Phase or Decline Phase or Slow Growth Phase

The rate of growth decreases and becomes limited owing to internal and external or both the factors because the metabolic process becomes slow.

4. Steady State Period or Maturation Phase

In this phase cell wall thickening due to new particle deposition on the inner surface of the cell wall takes place. The overall growth ceases and becomes constant. The growth rate becomes zero.

Types of Growth Rate

The increased growth per unit time is termed as growth rate. An organism or part of an organism can produce more cells through arithmetic growth or geometric growth or both.

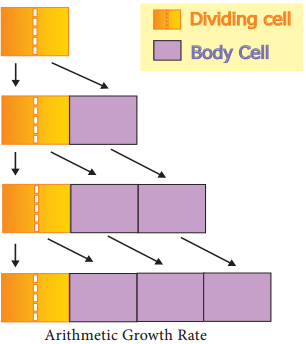
(i) Arithmetic Growth Rate

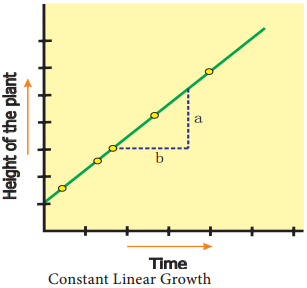
If the length of a plant organ is plotted against time, it shows a linear curve and this growth is called arithmetic growth.

  • The rate of growth is constant and it increases in an arithmetic manner.
  • Only one cell is allowed to divide between the two-resulting progeny cell.
  • One continues to divide but the other undergoes cell cycle arrest and begins to develop, differentiate and mature.
  • After each round of cell division, only a single cell remains capable of division and one new body cell forms.

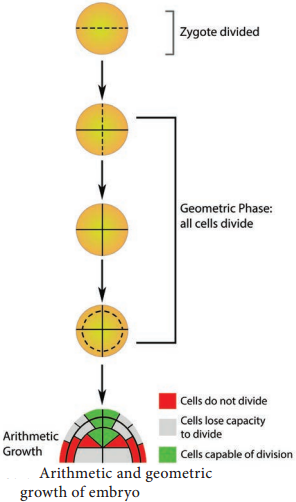
For example, starting with a single cell after round 1 of cell division there is one dividing cell and one body cell. After round 2 there are two body cells, after round 3 there are three and so on (Figure 15.1).
Characteristics of Growth img 1

The plants single dividing cell would undergo one million rounds of nuclear and cellular division. If each round requires one day, this type of arithmetic increase would require one million days or 2739.7 years. This arithmetic rate is capable of producing small number of cells present in very small parts of plants. For example the hair on many leaves and stems consists of just a single row of cells produced by the division of the basal cell, the cell at the bottom of the hair next to other epidermal cells.

Hair may contain 5 to 10 cells by the division of the basal cell. So, all its cells could be produced in just fie to ten days. In the figure 15.2, on plotting the hight of the plant against time a linear curve is obtained. Mathematically it is expressed as:
Characteristics of Growth img 2

Lt = L0 + rt
Lt = length at time ‘t’
L0 = length at time zero
R = Growth Rate of Elongation Per Unit

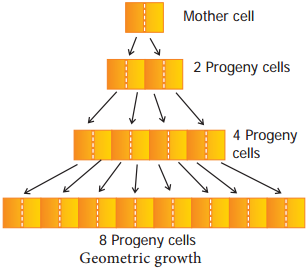
(ii) Geometric Growth Rate:

This growth occurs in many higher plants and plant organs and is measured in size or weight. In plant growth, geometric cell division results if all cells of an organism or tissue are active mitotically. Example: Round three in the given figure 15.3, produces 8 cells as 23 = 8 and after round 20 there are 220 = 1,048,576 cells.

The large plant or animal parts are produced this way. In fact, it is common in animals but rare in plants except when they are young and small. Exponential growth curve can be expressed as,
Characteristics of Growth img 3

W1 = W0ert
W1 = Final size (weight, height and number)
W0 = Initial size at the beginning of the period
r = Growth rate
t = Time of growth
e = Base of the natural logarithms

Here ‘r’ is the relative growth rate and also a measure of the ability of the plant to produce new plant material, referred to as efficiency index. Hence, the final size of W1 depends on the initial size W0.

(iii) Arithmetic and Geometric Growth of Embryo

Plants often grow by a combination of arithmetic and geometric growth patterns. A young embryonic plant grows geometrically and cell division becomes restricted to certain cells at the tips of roots and shoots. After this point, growth is of the slower arithmetic type, but some of the new cells that are produced can develop into their mature condition and begin carrying out specialized types of metabolism (Figure 15.4). Plants are thus a mixture of older, mature cells and young, dividing cells.
Characteristics of Growth img 4

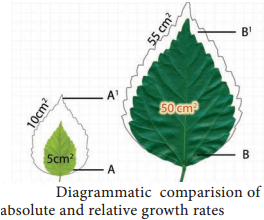
Quantitative comparisons between the growth of living system can also be made in two ways and is explained in the table 1. In figure 15.5, two leaves A and B are drawn at a particular time. Then A1 and B1 are drawn after a given time. A 1 and B1 = Area of leaves at a particular time. A1 and B1 = Area of leaves after a given time.

(A1 – A) and (B1 – B) represents an absolute increase in area in the given time. Leaf A increases from 5 cm2 to 10 cm2; 5 cm2 in a given time. Leaf B increases from 50 cm2 to 55 cm2; 5 cm2 in a given time. Hence, both leaves A and B increase their area by 5 cm2 in a given time. This is absolute growth. Relative growth is faster in leaf A because of initial small size. It decreases with time.
Characteristics of Growth img 5

Photoperiodism

Learninsta presents the core concepts of Biology with high-quality research papers and topical review articles.

Photoperiodism

Trees take several years for initiation of flowering whereas an annual herb flowers within few months. Each plant requires a specific time period to complete their vegetative phase which will be followed by reproductive phase as per their internal control points through Biological Clock.

The physiological mechanisms in relation to flowering are controlled by

  1. Light period (Photoperiodism) and
  2. Temperature (Vernalization)

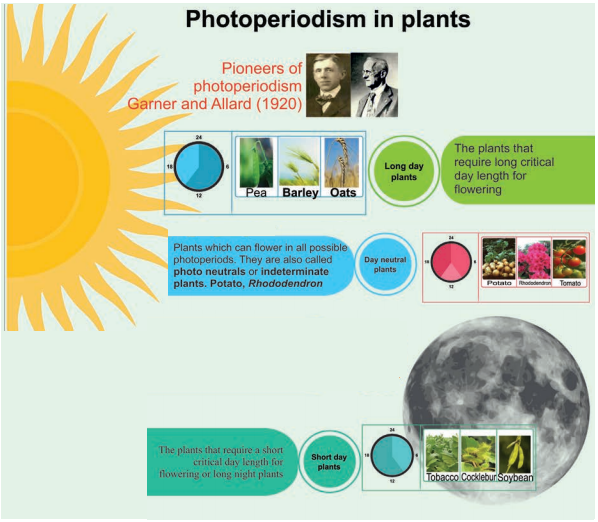
The physiological change on flowering due to relative length of light and darkness (photoperiod) is called Photoperiodism. The term photoperiodism was coined by Garner and Allard (1920) when they observed this in ‘Biloxi’ variety of soybean (Glycine max) and ‘Maryland mammoth’ variety of tobacco (Nicotiana tabacum).

The photoperiod required to induce flowering is called critical day length. Maryland mammoth (tobacco variety) requires 12 hours of light and cocklebur (Xanthium pensylvanicum) requires 15.05 hours of light for flowering.

1. Classification of Plants Based on Photoperiodism

(i) Long Day Plants:
The plants that require long critical day length for flowering are called long day plants or short night plants. Example: Pea, Barley and Oats.

(ii) Short Day Plants:
The plants that require a short critical day length for flowering are called short day plants or long night plants. Example: Tobacco, Cocklebur, Soybean, Rice and Chrysanthemum.

(iii) Day Neutral Plants:
There are a number of plants which can flower in all possible photoperiods. They are also called photo neutrals or indeterminate plants. Example: Potato, Rhododendron, Tomato and Cotton.

2. Photoperiodic Induction

An appropriate photoperiod in 24 hours cycle constitutes one inductive cycle. Plants may require one or more inductive cycles for flowering. The phenomenon of conversion of leaf primordia into flower primordia under the influence of suitable inductive cycles is called photoperiodic induction. Example: Xanthium (SDP) – 1 inductive cycle and Plantago (LDP) – 25 inductive cycles.

3. Site of Photoinductive Perception

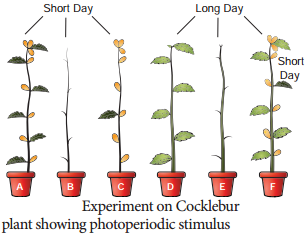
Photoperiodic stimulus is perceived by the leaves. Floral hormone is synthesised in leaves and translocated to the apical tip to promote flowering. This can be explained by a simple experiment on Cocklebur (Xanthium pensylvanicum), a short day plant. Usually Xanthium will flower under short day conditions. If the plant is defoliated and kept under short day conditions it will not flower.

Flowering will occur even when all the leaves are removed except one leaf. If a cocklebur plant is defoliated and kept under long day conditions, it will not flower. If one of its leaves is exposed to short day condition and rest are in long day condition, flowering will occur (Figure 15.10).
Photoperiodism img 1

4. Importance of Photoperiodism

  • The knowledge of photoperiodism plays an important role in hybridisation experiments.
  • Photoperiodism is an excellent example of physiological pre-conditioning that is using an external factor to induce physiological changes in the plant.

5. Phytochrome

Phytochrome is a bluish biliprotein pigment responsible for the perception of light in photo physiological process. Butler et al., (1959) named this pigment and it exists in two interconvertible forms:

  • Red Light absorbing pigment which is designated as Pr and
  • Far red light absorbing pigment which is designated as Pfr. The Pr form absorbs red light in 660nm
    and changes to Pfr.

The Pfr form absorbs far red light in 730nm and changes to Pr. The Pr form is biologically inactive and it is stable whereas Pfr form is biologically active and it is very unstable. In short day plants, Pr promotes flowering and Pfr inhibits the flowering whereas in long day plants flowering is promoted by Pfr and inhibited by Pr form.
Photoperiodism img 2

Pfr is always associated with hydrophobic area of membrane systems while Pr is found in diffused state in the cytoplasm. The interconversion of the two forms of phytochrome is mainly involved in flower induction and also additionally plays a role in seed germination and changes in membrane conformation.
Photoperiodism img 3

Pentose Phosphate Pathway

Learninsta presents the core concepts of Biology with high-quality research papers and topical review articles.

Pentose Phosphate Pathway

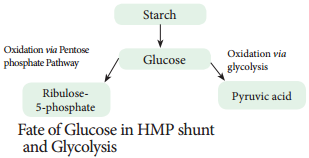
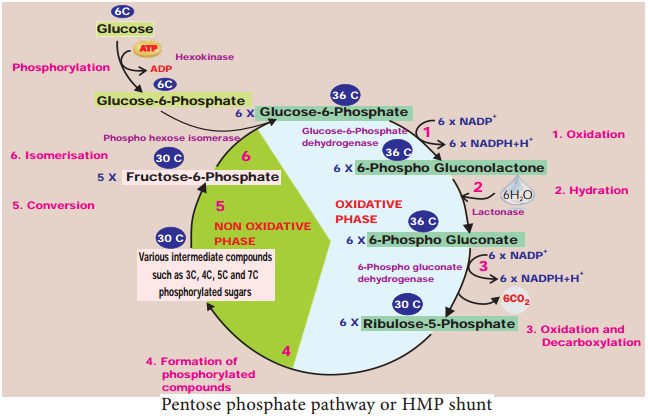
During respiration breakdown of glucose in cytosol occurs both by glycolysis (about 2/3) as well as by oxidative pentose phosphate pathway (about 1/3). Pentose phosphate pathway was described by Warburg, Dickens and Lipmann (1938). Hence, it is also called Warburg-Dickens-Lipmann pathway. It takes place in cytoplasm of mature plant cells. It is an alternate way for breakdown of glucose (Figure 14.15).
Pentose Phosphate Pathway img 1

It is also known as Hexosemonophosphate shunt (HMP Shunt) or Direct Oxidative Pathway. It consists of two phases, oxidative phase and non-oxidative phase. The oxidative events convert six molecules of six carbon Glucose-6-phosphate to 6 molecules of five carbon sugar Ribulose-5 phosphate with loss of 6CO2 molecules and generation of 12 NADPH + H+ (not NADH).

The remaining reactions known as non-oxidative pathway, convert Ribulose-5-phosphate molecules to various intermediates such as Ribose-5-phosphate(5C), Xylulose-5-phosphate(5C), Glyceraldehyde-3 phosphate(3C), Sedoheptulose-7-Phosphate (7C), and Erythrose-4-phosphate (4C). Finally, five molecules of glucose-6-phosphate is regene-rated (Figure 14.16). The overall reaction is:

6 × Glucose-6-Phosphate + 12NADP+ + 6H2O

5 × Glucose-6-Phosphate + 6CO2 + Pi + 12NADPH + 12H+

Pentose Phosphate Pathway img 2
The net result of complete oxidation of one glucose-6-phosphate yield 6CO2 and 12NADPH + H+. The oxidative pentose phosphate pathway is controlled by glucose-6-phosphate dehydrogenase enzyme which is inhibited by high ratio of NADPH to NADP+. Significance of pentose phosphate pathway.

  1. HMP shunt is associated with the generation of two important products, NADPH and pentose sugars, which play a vital role in anabolic reactions.
  2. Coenzyme NADPH generated is used for reductive biosynthesis and counter damaging the effects of oxygen free radicals
  3. Ribose-5-phosphate and its derivatives are used in the synthesis of DNA, RNA, ATP, NAD+, FAD and Coenzyme A.
  4. Erythrose is used for synthesis of anthocyanin, lignin and other aromatic compounds.
  5. It plays a role on fixation of CO2 in photosynthesis through RUBP.

Factors Affecting Respiration

Learninsta presents the core concepts of Biology with high-quality research papers and topical review articles.

Factors Affecting Respiration

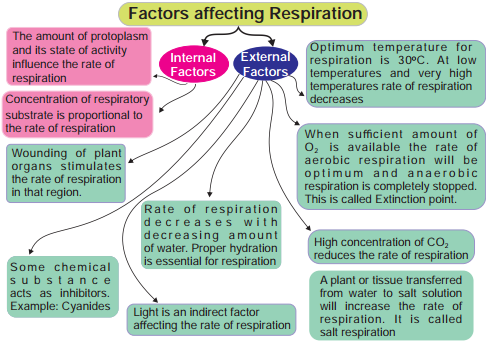
The eight environmental factors effecting the rate of respiration are:

  1. Oxygen Content of the Atmosphere
  2. Effect of Temperature
  3. Effect of Light
  4. Effect of Water Contents
  5. Effect of Respirable Material
  6. Effect of Carbon Dioxide Concentration
  7. Protoplasmic Conditions and
  8. Other Factors

The process of respiration is influenced by a number of external and internal factors. The main external factors are temperature, light, oxygen supply, water supply, CO2 concentration, toxic and stimulating substances and disease and injury.

For most plant species temperature, acidity, salt concentration and the amount of moisture, carbon dioxide and oxygen are some of the additional important factors which affect respiration. Let’s see the factors affecting the rate of respiration.

Temperature:
At a very high temperature, the rate of respiration decreases with time, and at very low temperature, the respiration rate is insignificant.

Carbon Dioxide Concentration:
The higher the carbon dioxide concentration, the lower the rate of respiration.

Explanation:
The rate of breathing is affected by many chemical factors like the level of carbon dioxide and oxygen in the blood. The increase in levels of the carbon dioxide will lower the blood pH this will direct the medulla of the brain to increase the breathing rate to obtain more amount of oxygen in the body.

Brainstem Rhythmicity Center. Breathing usually takes place outside of your conscious awareness. Blood Carbon Dioxide. The amount of carbon dioxide in the blood exerts a strong influence on respiratory rate. Blood pH.

The main factors affecting breathing rate are the levels of carbon dioxide and oxygen in the blood, and the blood’s pH. The main factors affecting rate of photosynthesis are light intensity, carbon dioxide concentration and temperature.

Several factors can affect the rate of photosynthesis:

  • Light Intensity
  • Carbon Dioxide Concentration
  • Temperature

Chemical – carbon dioxide, hydrogen ions and oxygen levels are the most important factors that regulate respiration. CO2 levels are the main influence, oxygen levels only affect breathing with dangerously low.

Oxygen, carbondioxide, temperature, light, availability of respirable materials etc., affect the rate of respiration. Oxygen is most important for aerobic respiration.

The temperature, light, materils of respiration such as carbohydrates, fats, proteins, etc., affect the rate of aerobic respiration.

External Factors:
Many external factors like temperature, light, carbon dioxide etc., affect the rate of respiration.

Temperature:
Temperature significantly affects the rate of respiration. Usually, the rate of respiration increases with the increase in temperature in the range of 0-45 degree centigrade.

  • Factors that influence blood pressure
  • Cardiac output
  • Peripheral vascular resistance
  • Volume of circulating blood
  • Viscosity of blood
  • Elasticity of vessels walls

The factors that affects temperature are altitude, latitude and distance from sea. The height measured from sea level is called altitude. When the latitude increases, the distant from the sun also increases, so the temperature gradually decreases. When the altitude increases, the temperature also gradually decreases.

The rate of respiration is normally not affected by increase of carbon dioxide concentration in the surrounding atmosphere up to 19%, but as the concentration increases from 10% to 80%, a progressive decrease in respiration occurs.

Normally, an increased concentration of carbon dioxide is the strongest stimulus to breathe more deeply and more frequently. Conversely, when the carbon dioxide concentration in the blood is low, the brain decreases the frequency and depth of breaths.

The external or environmental factors at: A light intensity, carbon dioxide concentration and temperature. The internal factor influencing the photosynthesis is chlorophyll content of the leaves and protoplasmic factors.

The environmental factors which can affect the rate of photosynthesis are carbon dioxide, light, temperature, water, oxygen, minerals, pollutants and inhibitors.

1. Effect of Carbon Dioxide:
Being one of the raw materials, carbon dioxide concentration has great effect on the rate of photosynthesis.
Factors Affecting Respiration img 1

Anaerobic Respiration

Learninsta presents the core concepts of Biology with high-quality research papers and topical review articles.

Anaerobic Respiration

Fermentation

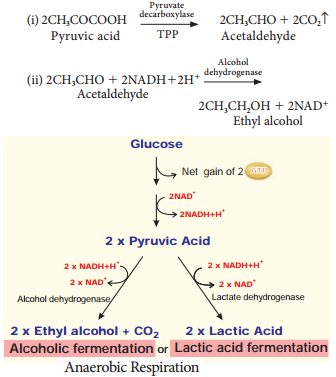
Some organisms can respire in the absence of oxygen. This process is called fermentation or anaerobic respiration (Figure 14.12). There are three types of fermentation:

  1. Alcoholic Fermentation
  2. Lactic Acid Fermentation
  3. Mixed Acid Fermentation

1. Alcoholic Fermentation

The cells of roots in water logged soil respire by alcoholic fermentation because of lack of oxygen by converting pyruvic acid into ethyl alcohol and CO2. Many species of yeast (Saccharomyces) also respire anaerobically. This process takes place in two steps:
Anaerobic Respiration img 1

Industrial Uses of Alcoholic Fermentation:

  1. In bakeries, it is used for preparing bread, cakes, biscuits.
  2. In beverage industries for preparing wine and alcoholic drinks.
  3. In producing vinegar and in tanning, curing of leather.
  4. Ethanol is used to make gasohol (a fuel that is used for cars in Brazil).

2. Lactic Acid Fermentation

Some bacteria (Bacillus), fungi and muscles of vertebrates produce lactic acid from pyruvic acid (Table 14.3).

3. Mixed Acid Fermentation

This type of fermentation is a characteristic feature of Enterobacteriaceae and results in the formation of lactic acid, ethanol, formic acid and gases like CO2 and H2.

Characteristics of Anaerobic Respiration

  1. Anaerobic respiration is less efficient than the aerobic respiration (Figure 14.12).
  2. Limited number of ATP molecules is generated per glucose molecule (Table 14.4).
  3. It is characterized by the production of CO2 and it is used for Carbon fixation in photosynthesis.

Net Products from one molecule of Glucose under Glycolysis and Anaeorbic Respiration

Respiratory Quotient

Learninsta presents the core concepts of Biology with high-quality research papers and topical review articles.

Respiratory Quotient

The ratio of volume of carbon dioxide given out and volume of oxygen taken in during respiration is called Respiratory Quotient or Respiratory ratio. RQ value depends upon respiratory substrates and their oxidation.
Respiratory Quotient img 1

1. The respiratory substrate is a carbohydrate, it will be completely oxidised in aerobic respiration and the value of the RQ will be equal to unity.
Respiratory Quotient img 2
= 1(unity)

2. If the respiratory substrate is a carbohydrate it will be incompletely oxidised when it goes through anaerobic respiration and the RQ value will be infinity.
Respiratory Quotient img 3
= ∞ (infintiy)

3. In some succulent plants like Opuntia, Bryophyllum carbohydrates are partially oxidised to organic acid, particularly malic acid without corresponding release of CO2 but O2 is consumed hence the RQ value will be zero.
Respiratory Quotient img 4
= 0(zero)

4. When respiratory substrate is protein or fat, then RQ will be less than unity.
Respiratory Quotient img 5
= 0.7 (less than unity)

5. When respiratory substrate is an organic acid the value of RQ will be more than unity.
Respiratory Quotient img 6
= 1.33 (more than unity)

Significance of RQ

  1. RQ value indicates which type of respiration occurs in living cells, either aerobic or anaerobic.
  2. It also helps to know which type of respiratory substrate is involved.

Stages of Respiration – Definition, Phases, Flow Chart

Learninsta presents the core concepts of Biology with high-quality research papers and topical review articles.

Stages of Respiration – Definition, Phases, Flow Chart

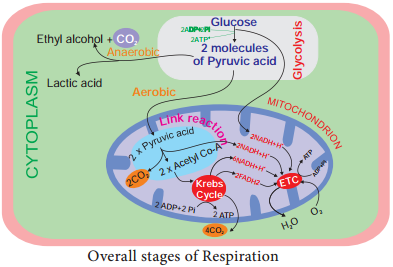
  1. Glycolysis-conversion of glucose into pyruvic acid in cytoplasm of cell.
  2. Link reaction-conversion of pyruvic acid into acetyl coenzyme-A in mitochondrial matrix.
  3. Krebs cycle-conversion of acetyl coenzyme A into carbon dioxide and water in the mitochondrial matrix.
  4. Electron transport chain to tranfer electrons remove hydrogen ions and transfer electrons from the products of glycolysis, link reaction and Krebs cycle.
  5. It takes place in mitochondrial inner membrane to release ATP with water molecule by terminal oxidation (Figure 14.5).

Stages of Respiration img 1

Glycolysis

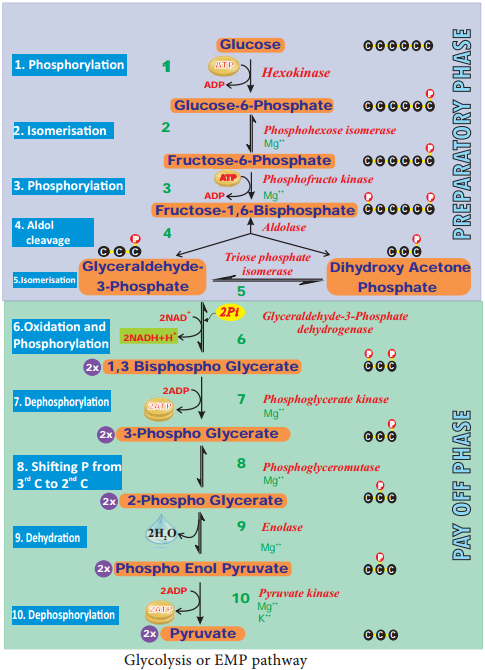
(Gr: Glykos 5 Glucose, Lysis 5 Splitting) Glycolysis is a linear series of reactions in which 6-carbon glucose is split into two molecules of 3-carbon pyruvic acid. The enzymes which are required for glycolysis are present in the cytoplasm (Figure 14.6).

The reactions of glycolysis were worked out in yeast cells by three scientists Gustav Embden (German), Otto Meyerhoff (German) and J Parnas (Polish) and so it is also called as EMP pathway. It is the first and common stage for both aerobic and anaerobic respiration. It is divided into two phases.

  1. Preparatory phase or endergonic phase or hexose phase (steps 1-5).
  2. Pay off phase or oxidative phase or exergonic phase or triose phase (steps 6-10).

1. Preparatory Phase

Glucose enters the glycolysis from sucrose which is the end product of photosynthesis. Glucose is phosphorylated into glucose-6-phosphate by the enzyme hexokinase, and subsequent reactions are carried out by different enzymes (Figure 14.6). At the end of this phase fructose-1, 6-bisphosphate is cleaved into glyceraldehyde-3-phosphate and dihydroxy acetone phosphate by the enzyme aldolase.

These two are isomers. Dihydroxy acetone phosphate is isomerised into glyceraldehyde-3-phosphate by the enzyme triose phosphate isomerase, now two molecules of glyceraldehyde 3 phosphate enter into pay off phase. During preparatory phase two ATP molecules are consumed in step-1 and step-3 (Figure 14.6).
Stages of Respiration img 2

Pay Off Phase

Two molecules of glyceraldehyde-3-phosphate oxidatively phosphorylated into two molecules of 1,3 – bisphospho glycerate. During this reaction 2NAD+ is reduced to 2NADH+H+ by glyceraldehyde-3-phosphate dehydrogenase at step 6. Further reactions are carried out by different enzymes and at the end two molecules of pyruvate are produced.

In this phase, 2ATPs are produced at step 7 and 2 ATPs at step10 (Figure 14.6). Direct transfer of phosphate moiety from substrate molecule to ADP and is converted into ATP is called substrate phosphorylation or direct phosphorylation or trans phosphorylation. During the reaction at step 9, 2 phospho glycerate dehydrated into Phospho enol pyruvate. A water molecule is removed by the enzyme enolase. As a result, enol group is formed within the molecule. This process is called Enolation.
Stages of Respiration img 3

3. Energy Budget

In the pay off phase totally 4ATP and 2NADH + H+ molecules are produced. Since 2ATP molecules are already consumed in the preparatory phase, the net products in glycolysis are 2ATPs and 2NADH + H+.

The Overall Net Reaction of Glycolysis

C6H12O6 + 2ADP + 2Pi + 2NAD+

2x CH3COCOOH + 2ATP + 2NADH + 2H+

Pyruvate Oxidation (Link reaction)

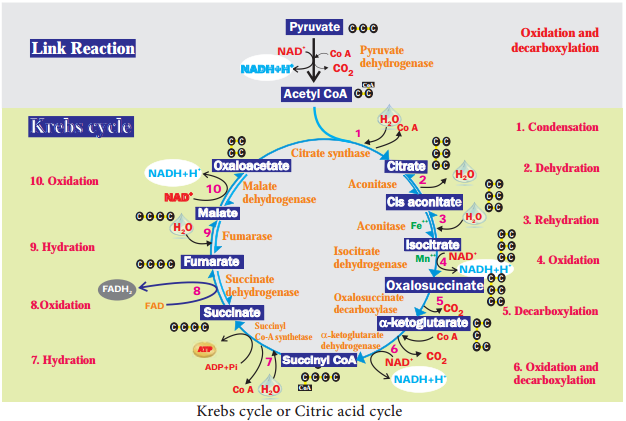
Two molecules of pyruvate formed by glycolysis in the cytosol enters into the mitochondrial matrix. In aerobic respiration this pyruvate with coenzyme A is oxidatively decarboxylated into acetyl CoA by pyruvate dehydrogenase complex. This reaction is irreversible and produces two molecules of NADH + H+ and 2CO2. It is also called transition reaction or Link reaction. The reaction of pyruvate oxidation is Pyruvate.
Stages of Respiration img 3

Krebs Cycle or Citric Acid Cycle or TCA Cycle:

Two molecules of acetyl CoA formed from link reaction now enter into Krebs cycle. It is named after its discoverer, German Biochemist Sir Hans Adolf Krebs (1937). The enzymes necessary for TCA cycle are found in mitochondrial matrix except succinate dehydrogenase enzyme which is found in mitochondrial inner membrane (Figure 14.7).
Stages of Respiration img 4

TCA cycle starts with condensation of acetyl CoA with oxaloacetate in the presence of water to yield citrate or citric acid. Therefore, it is also known as Citric Acid Cycle (CAC) or Tri Carboxylic Acid (TCA) cycle. It is followed by the action of different enzymes in cyclic manner.

During the conversion of succinyl CoA to succinate by the enzyme succinyl CoA synthetase or succinate thiokinase, a molecule of ATP synthesis from substrate without entering the electron transport chain is called substrate level phosphorylation.

In animals a molecule of GTP is synthesized from GDP + Pi. In a coupled reaction GTP is converted to GDP with simultaneous synthesis of ATP from ADP + Pi. In three steps (4, 6, 10) in this cycle NAD+ is reduced to NADH + H+ and at step 8 (Figure 14.8) where FAD is reduced to FADH2.

The summary of link reaction and Krebs cycle in Mitochondria is
Stages of Respiration img 5

Two molecules of pyruvic acid formed at the end of glycolysis enter into the mitochondrial matrix. Therefore, Krebs cycle is repeated twice for every glucose molecule where two molecules of pyruvic acid produces six molecules of CO2, eight molecules of NADH + H+, two molecules of FADH2 and two molecules of ATP.

1. Significance of Krebs Cycle:

1. TCA cycle is to provide energy in the form of ATP for metabolism in plants.
2. It provides carbon skeleton or raw material for various anabolic processes.
3. Many intermediates of TCA cycle are further metabolised to produce amino acids, proteins and nucleic acids.
4. Succinyl CoA is raw material for formation of chlorophylls, cytochrome, phytochrome and other pyrrole substances.
5. α-ketoglutarate and oxaloacetate undergo reductive amination and produce amino acids.
6. It acts as metabolic sink which plays a central role in intermediary metabolism.

2. Amphibolic Nature

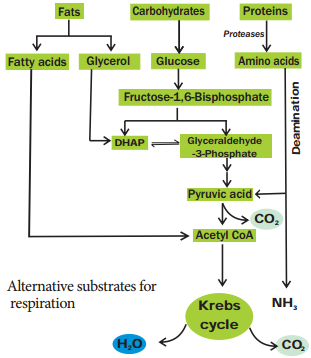
Krebs cycle is primarily a catabolic pathway, but it provides precursors for various biosynthetic pathways there by an anabolic pathway too. Hence, it is called amphibolic pathway. It serves as a pathway for oxidation of carbohydrates, fats and proteins.

When fats are respiratory substrate they are first broken down into glycerol and fatty acid. Glycerol is converted into DHAP and acetyl CoA. This acetyl CoA enter into the Krebs cycle.

When proteins are the respiratory substrate they are degraded into amino acids by proteases. The amino acids after deamination enter into the Krebs cycle through pyruvic acid or acetyl CoA and it depends upon the structure.

So respiratory intermediates form the link between synthesis as well as breakdown. The citric acid cycle is the final common pathway for oxidation of fuel molecules like amino acids, fatty acids and carbohydrates. Therefore, respiratory pathway is an amphibolic pathway (Figure 14.9).
Stages of Respiration img 6

Electron Transport Chain (ETC) (Terminal Oxidation)

During glycolysis, link reaction and Krebs cycle the respiratory substrates are oxidised at several steps and as a result many reduced coenzymes NADH + H+ and FADH2 are produced. These reduced coenzymes are transported to inner membrane of mitochondria and are converted back to their oxidised forms produce electrons and protons.

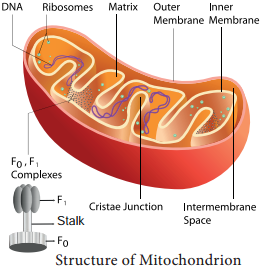
In mitochondria, the inner membrane is folded in the form of finger projections towards the matrix called cristae. In cristae many oxysomes (F1 particles) are present which have electron transport carriers. According to Peter Mitchell’s Chemiosmotic theory this electron transport is coupled to ATP synthesis. Electron and hydrogen(proton) transport takes place across four multiprotein complexes(I-IV). They are:-

1. Complex-I (NADH Dehydrogenase):

It contains a flavoprotein(FMN) and associated with non-heme iron Sulphur protein (Fe-S). This complex is responsible for passing electrons and protons from mitochondrial NADH (Internal) to Ubiquinone (UQ).

NADH + H+ + UQ ⇄ NAD+ + UQH2

In plants, an additional NADH dehydrogenase (External) complex is present on the outer surface of inner membrane of mitochondria which can oxidise cytosolic NADH + H+. Because mitochondrial inner membrane cannot allow NADH molecules directly into the matrix. Ubiquinone (UQ) or Coenzyme Quinone (CoQ) is a small, lipid soluble electron, proton carrier located within the inner membrane of mitochondria.

2. Complex-II (Succinic Dehydrogenase)

It contains FAD flavoprotein is associated with non-heme iron Sulphur (Fe-S) protein. This complex receives electrons and protons from succinate in Krebs cycle and is converted into fumarate and passes to ubiquinone. Succinate + UQ → Fumarate + UQH2

3. Complex-III (Cytochrome bc1 Complex)

This complex oxidises reduced ubiquinone (ubiquinol) and transfers the electrons through Cytochrome bc1 Complex (Iron Sulphur center bc1 complex) to cytochrome.

Cytochrome c is a small protein attached to the outer surface of inner membrane and act as a mobile carrier to transfer electrons between complex III to complex IV.
Stages of Respiration img 7

4. Complex IV (Cytochome Oxidase)

This complex contains two copper centers (A and B) and cytochromes a and a3. Complex IV is the terminal oxidase and brings about the reduction of 1/2 O2 to H2O. Two protons are needed to form a molecule of H2O (terminal oxidation).
Stages of Respiration img 8

The transfer of electrons from reduced coenzyme NADH to oxygen via complexes I to IV is coupled to the synthesis of ATP from ADP and inorganic phosphate (Pi) which is called Oxidative phosphorylation. The F0F1. F1 converts ADP and Pi to ATP and is attached to the matrix side of the inner membrane. F0 is present in inner membrane and acts as a channel through which protons come into matrix.

Oxidation of one molecule of NADH + H+ gives rise to 3 molecules of ATP and oxidation of one molecule FADH2 produces 2 molecules of ATP within a mitochondrion. But cytoplasmic NADH + H+ yields only two ATPs through external NADH dehydrogenase.

Therefore, two reduced coenzyme (NADH + H+) molecules from glycolysis being extra mitochondrial will yield 2 × 2 = 4 ATP molecules instead of 6 ATPs (Figure 14.10). The Mechanism of mitochondrial ATP synthesis is based on Chemiosmotic hypothesis. According to this theory electron carriers present in the inner mitochondrial membrane allow for the transfer of protons (H+). For the production of single ATP, 3 protons (H+) are needed.

The terminal oxidation of external NADH bypasses the first phosphorylation site and hence only two ATP molecules are produced per external NADH oxidised through mitochondrial electron transport chain. However, in those animal tissues in which malate shuttle mechanism is present, the oxidation of external NADH will yield almost 3 ATP molecules.

Complete oxidation of a glucose molecule in aerobic respiration results in the net gain of 36 ATP molecules in plants as shown in table 14.2. Since huge amount of energy is generated in mitochondria in the form of ATP molecules they are called ‘power house of the cell’. In the case of aerobic prokaryotes due to lack of mitochondria each molecule of glucose produces 38 ATP molecules.

Stages

CO2 ATP Reduced NAD+ Reduced FAD

Total ATP
Production

Glycolysis 0 2 2(2 × 2 = 4) 0 6
Link reaction 2 0 (2 × 3) = 6 0 6
Krebs cycle 4 2 (6 × 3 = 18) 2 (2 × 2 = 4) 24
Total 6 4 ATPs 28 ATPs 4 ATPs 36 ATPs

Recent View

When the cost of transport of ATPs from matrix into the cytosol is considered, the number will be 2.5 ATPs for each NADH + H+ and 1.5 ATPs for each FADH2 oxidised during electron transport system. Therefore, in plant cells net yield of 30 ATP molecules for complete aerobic oxidation of one molecule of glucose. But in those animal cells (showing malate shuttle mechanism) net yield will be 32 ATP molecules.