Selina Concise Mathematics Class 10 ICSE Solutions Chapter 24 Measures of Central Tendency (Mean, Median, Quartiles and Mode) Ex 24C
These Solutions are part of Selina Concise Mathematics Class 10 ICSE Solutions. Here we have given Chapter 24 Measures of Central Tendency (Mean, Median, Quartiles and Mode) Ex 24C.
Other Exercises
- Selina Concise Mathematics Class 10 ICSE Solutions Chapter 24 Measures of Central Tendency Ex 24A
- Selina Concise Mathematics Class 10 ICSE Solutions Chapter 24 Measures of Central Tendency Ex 24B
- Selina Concise Mathematics Class 10 ICSE Solutions Chapter 24 Measures of Central Tendency Ex 24C
- Selina Concise Mathematics Class 10 ICSE Solutions Chapter 24 Measures of Central Tendency Ex 24D
- Selina Concise Mathematics Class 10 ICSE Solutions Chapter 24 Measures of Central Tendency Ex 24E
Question 1.
A student got the following marks in 9 questions of a question paper : 3, 5, 7, 3, 8, 0, 1, 4 and 6.
Find the median of these marks.
Solution:
Arranging the given data in descending order, we get:
8, 7, 6, 5,4,3, 3, 1,0
The middle term is 4 which is 5th terms
∴ Median = 4
Question 2.
The weights (in kg) of 10 students of a class are given below :
21, 28.5, 20.5, 24, 25.5, 22, 27.5, 28, 21, 24 Find the median of their weights.
Solution:
Arranging the given data in descending order.
We get 23.5, 28, 27.5, 25.5, 24, 24, 22, 21, 21, 20.5
the middle terms are 24 and 24, 5th and 6th terms.

Question 3.
The marks obtained by 19 students of a class are given below :
27, 36, 22, 31, 25, 26, 33, 24, 37, 32, 29, 28, 36, 35, 27, 26, 32, 35, 28. Find :
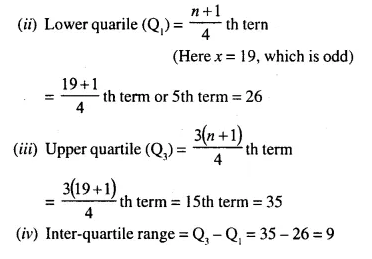
(i) Media
(ii) Lower quartile
(iii) Upper quartile
(iv) Inter – quartle range
Solution:
(i) Arranging in order say ascending, we get
22, 24, 25, 26, 26, 27, 27, 28, 28, 29, 31, 32, 32, 33, 35, 35,36, 36, 37
Middle term is 10th term i.e. 29
∴ Median = 29
Question 4.
From the following data, find :
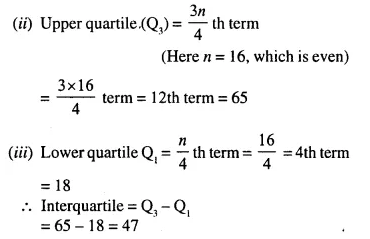
(i) Median
(ii) Upper quartile
(iii) Inter-quartile range
25,10, 40, 88, 45, 60, 77, 36,18, 95, 56, 65, 7, 0, 38 and 83.
Solution:
(i) Arrange in ascending order, we get
0,7, 10, 18, 25, 36, 38, 40, 45, 56, 60, 65 ,77, 83, 88, 95
Question 5.
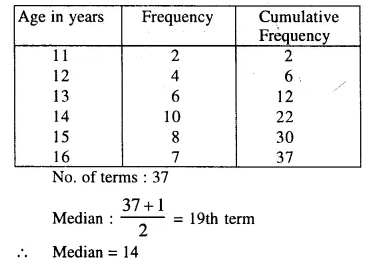
The ages of 37 students in a class are given in the following table :

Find the median.
Solution:
Question 6.
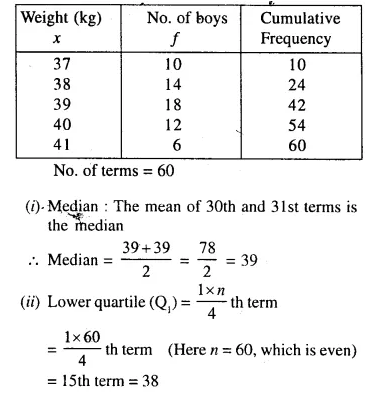
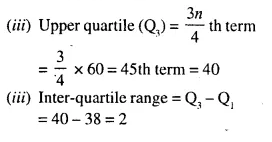
The weight of 60 boys are given in the following distribution table :

Find : (i) Median
(ii) Lower quartile
(iii) Upper quartile
(iv) Inter-quartile range
Solution:
Question 7.
Estimate the median for the given data by drawing ogive :

Solution:
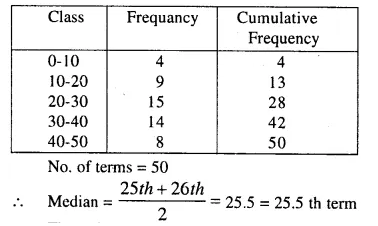
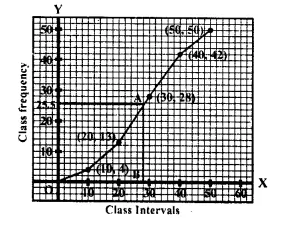
Through mark of 25.5 on the y-axis, draw a line parallel to x-axis which meets the curve at A. From A, draw a perpendicular to x-axis, which meets x-axis at B.
∴ The value of B is the median which is 28.
Question 8.
By drawing an ogive; estimate the median for the following frequency distribution :

Solution:
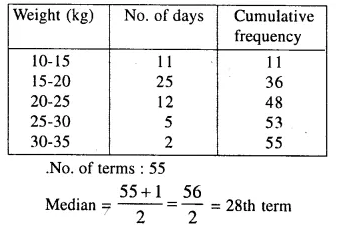
Through mark of 28th on the y- axis, draw a line parallel to x-axis which meets the curve at A. From A, draw a perpendicular line segment to x- axis. Which meets it at B.
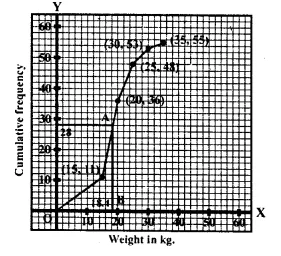
∴ The value of B is the median which is 18.4
Question 9.
From the following cumulative frequency table, draw ogive and then use it to find :
(i) Median,
(ii) Lower quartile,
(iii) Upper quartile.

Solution:
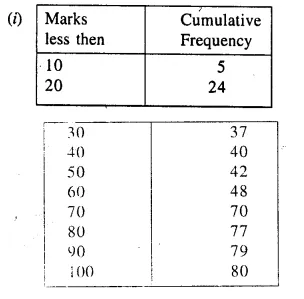
No. of terms = 80
Median = 40th term Through mark of 40 draw a line parallel to x-axis which meets the curve at A. From A, draw a perpendicular to x-axis which meets it at B
(ii) Lower quartile (Q1) = \(\frac { n }{ 4 }\) th term
= \(\frac { 80 }{ 4 }\) th term (Here n = 80 which is even)
= 20th term =18
(iii) Upper quartile (Q1) = \(\frac { 3 }{ 4 }\) nth term =\(\frac { 3 x80 }{ 4 }\) = 60th term = 66 .
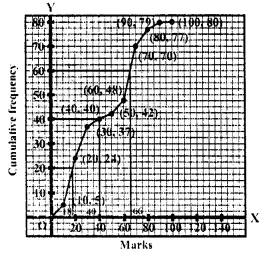
∴ Value of B is the median which is 40.
Question 10.
In a school 100 pupils have heights as tabulated below:
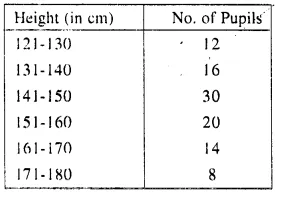
Find the median height by drawing an ogive.
Solution:
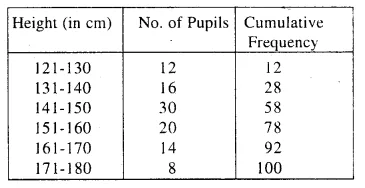
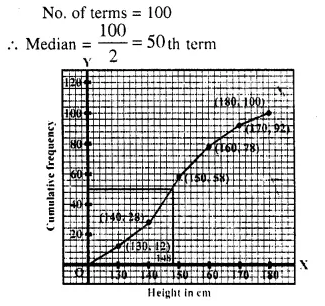
Through mark 50, draw a line parallel to x- axis which meets the curve at A. From A, draw per-pendicular to x-axis which meets x-axis at B is the median which is 148 cm.
P.Q.
Attempt this question on a graph paper. The table shows the distribution of marks gained by a group of 400 students in an examination :

Using a scale of 2 cm to represent 10 marks and 2 cm to represent 50 students, plot these points and draw a smooth curve through the points
Estimate from the graph :
(i) Median marks
(ii) quartile marks. [1997]
Solution:
Plot the points (10, 5), (20, 10), (30, 30), (40, 60), (50,105), (60,180), (70,270), (80, 355), (90, 390), (100, 400) on the graph and join them with free hand to get an ogive (curve) as shown:
(i) Total students = 400
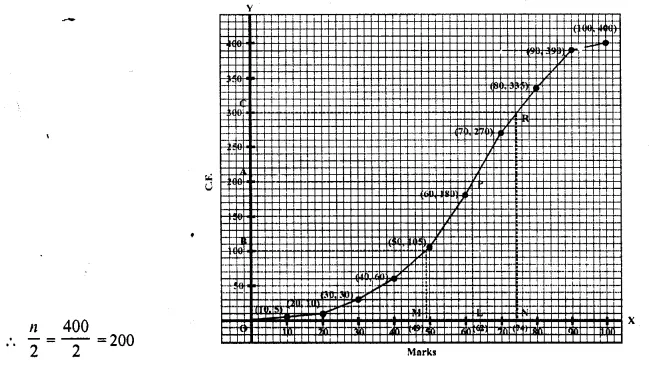
From 200 on y-axis draw a line parallel to x-axis meeting the curve at P. From P, draw PL perpendicular on x-axis then L is the median which is 62.
(ii) Lower quartile (Q1) = \(\frac { 1 }{ 4 }\) x n = \(\frac { 1 }{ 4 }\) x 400 =100
From 100 ony-axis, draw a line parallel to x-axis meeting the curve at Q, from Q, draw QM ⊥ x-axis.
M is the required lower quartile (Q1) which is 49 3 3
Upper quartile (Q3) = \(\frac { 3 }{ 4 }\) n = \(\frac { 3 }{ 4 }\) x 400 = 300
From 300 on y-axis, draw a line parallel to x-axis meeting the curve at R. From R draw RN perpendicular to x-axis N is the required upper quartile (Q3) which is = 74
P.Q.
Attempt this question on graph paper.

(i) Construct the ‘less than’ cumulative frequency curve for the above data, using 2 cm = 10 years on one axis and 2cm = 10 casualities on the other, (ii) From your graph determine :
(a) Median
(b) Lower quartile. (1995)
Solution:
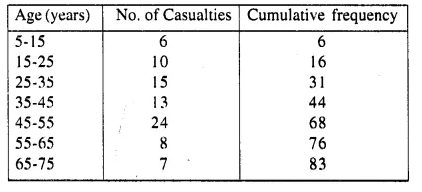
No. of terms = 83
∴ Median \(\frac { 83 }{ 2 }\) =41.5 th term .
Through marks 41.5,draw a line segment par allel to x-axis which meets the curve at A. From A, draw a line segment perpendicular to x-axis meeting it at B.
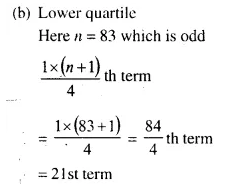
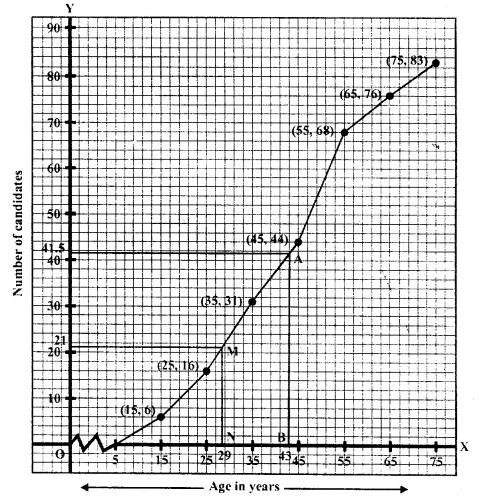
Through 21 on the y-axis draw a line parallel to x-axis meeting the curve at M
From M, draw a perpendicular on x-axis which meets it at N.
∴N is the lower quartile which is 29 (approx)
Hope given Selina Concise Mathematics Class 10 ICSE Solutions Chapter 24 Measures of Central Tendency Ex 24C are helpful to complete your math homework.
If you have any doubts, please comment below. Learn Insta try to provide online math tutoring for you.