RD Sharma Class 9 Solutions Chapter 23 Graphical Representation of Statistical Data Ex 23.2
These Solutions are part of RD Sharma Class 9 Solutions. Here we have given RD Sharma Class 9 Solutions Chapter 23 Graphical Representation of Statistical Data Ex 23.2
Other Exercises
- RD Sharma Class 9 Solutions Chapter 23 Graphical Representation of Statistical Data Ex 23.1
- RD Sharma Class 9 Solutions Chapter 23 Graphical Representation of Statistical Data Ex 23.2
- RD Sharma Class 9 Solutions Chapter 23 Graphical Representation of Statistical Data Ex 23.3
- RD Sharma Class 9 Solutions Chapter 23 Graphical Representation of Statistical Data MCQS
Question 1.
Explain the reading and interpretation of bar graphs.
Solution:
Reading and interpretation of the bar graph:
The first step in reading a bar graph is to know what it represents or what is the information given by it. For this, we read the captions which are generally written just below the horizontal line (x-axis) and adjacent to vertical line (y-axis). After knowing that what does a bar graph represent we read the scale so that we can know the precise values in the given data.
After reading a bar graph one must be able to draw certain conclusions from it. Drawing some conclusions from a given bar graph means interpretation of the bar graph.
Question 2.
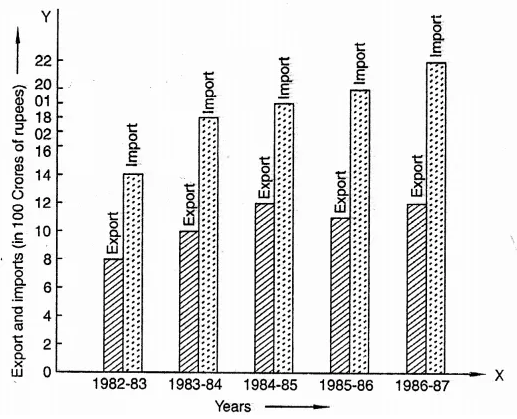
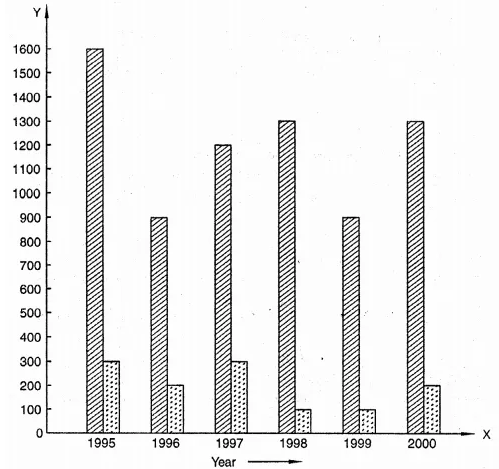
Read the following bar graph and answer the following questions:
(i) What information is given by the bar graph?
(ii) In which year the export is minimum?
(iii) In which year the import is maximum?
(iv) In which year the difference of the values of export and import is maximum?
Solution:
After reading the bar graph. We find:
(i) Export and import in 100 crores of rupees year wise.
(ii) In the year 1982-83, export is minimum i.e. 100 crores.
(iii) In the year 1986-87, import is maximum i.e. 22 hundred crores.
(iv) In the year 1986-87, the difference of the values of import and export is maximum i.e. 22 – 12 = 10 x 100 crore.
Question 3.
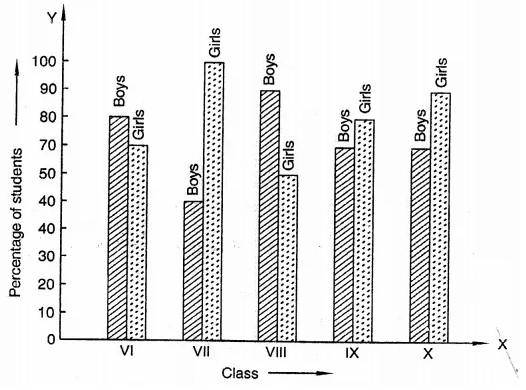
The following bar graph show’s the results of an annual examination in a secondary school.
Read the bar graph and choose the correct alternative in each of the following:
(i) The pair of classes in which the results of boys and girls are inversely proportional are:
(a) VI, VIII (b) VI, IX (c) VIII, IX (d) VIII, X
(ii) The class having the lowest failure rate of girls is
(a) VII (b) X (c) IX (d) VIII
(iii) The class having the lowest pass rate of students is
(a) VI (b) VII (c) VIII (d) IX
Solution:
After reading the given bar graph, we find that
(i) The pair of classes in which the results of boys and girls are inversely proportional is VI and IX as in VI, 80% boys and 70% girls and in IX, 70% boys and 80% girls are the results.
(ii) Lowest failure of girls of students is VII as pass % is 100%.
(iii) Class having the lowest pass rate is VII boys as it is 50% only.
Question 4.
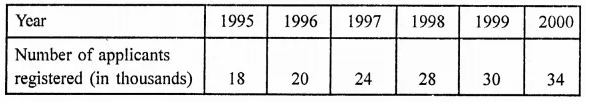
The following data gives the number (in thousands) of applicants registered with an Employment Exchange during, 1995-2000:
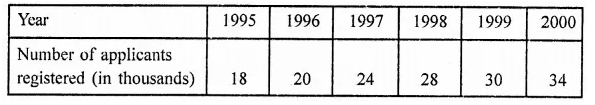
Construct a bar graph to represent the above data.
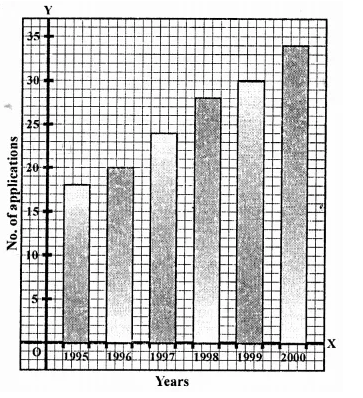
Solution:
Bar graph of the above is given below:
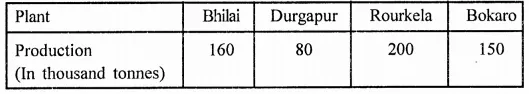
Question 5.
The production of saleable steel in some of the steel plants of our country during 1999 is given below:
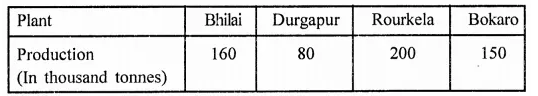
Construct a bar graph to represent the above data on a graph paper by using the scale 1 big divisions = 20 thousands tonnes.
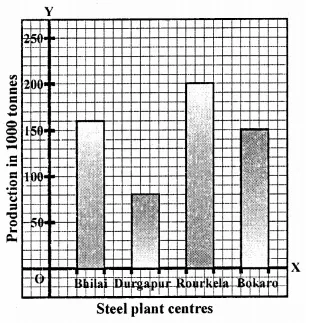
Solution:
Bar graph of the above data is given below:
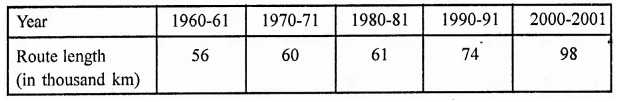
Question 6.
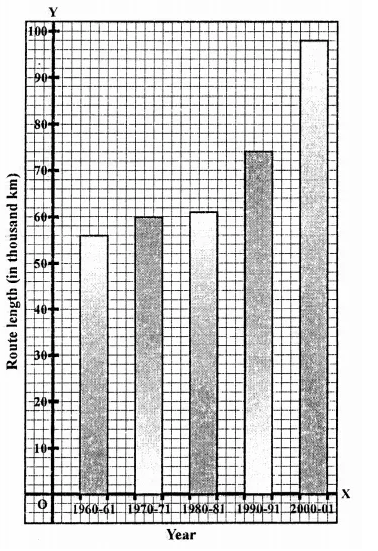
The following table gives the route length (in thousand kilometres) of the Indian Railways in some of the years:
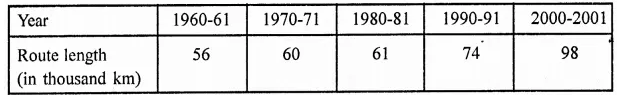
Represent the above data with the help of a bar graph.
Solution:
Question 7.
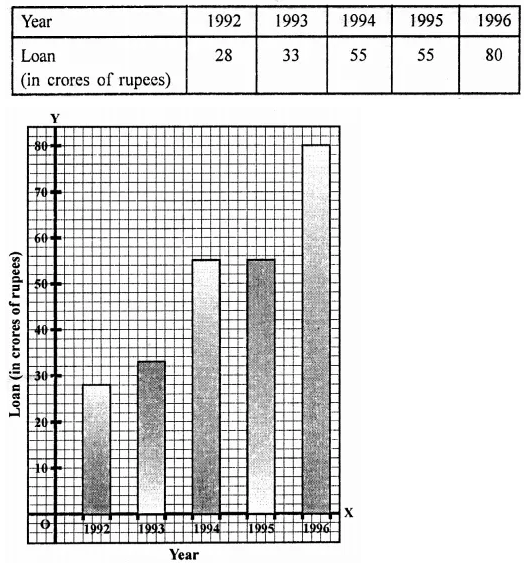
The following data gives the amount of loans (in crores of rupees) disbursed by a bank during some years:
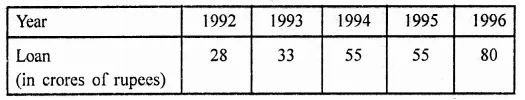
(i) Represent the above data with the help of a bar graph.
(ii) With the help of the bar graph, indicate the year in which amount of loan is not increased over that of the preceding year.
Solution:
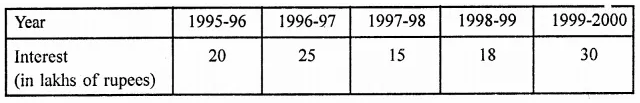
Question 8.
The following table shows the interest paid by a company (in lakhs):
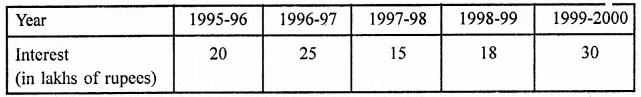
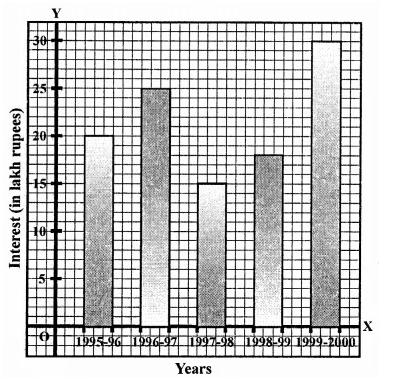
Draw the bar graph to represent the above information.
Solution:
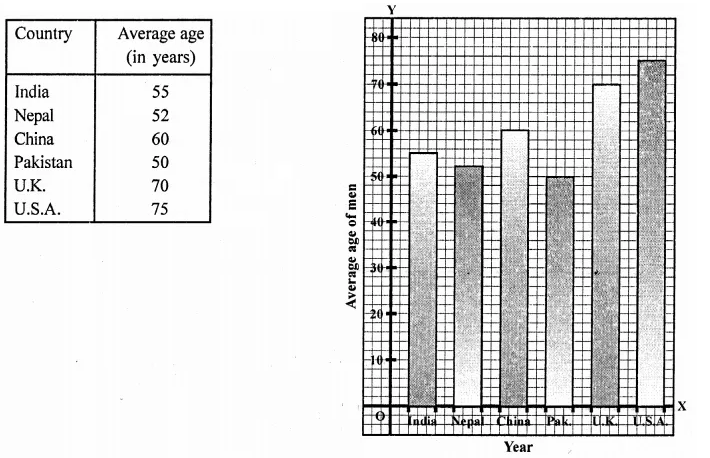
Question 9.
The following data shows the average age of men in various countries in a certain year:
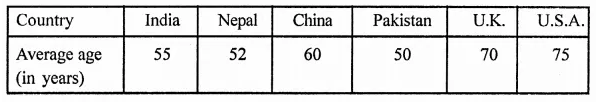
Represent the above information by a bar graph.
Solution:
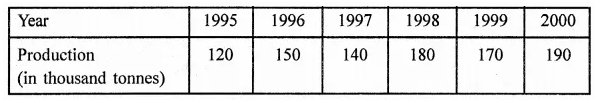
Question 10.
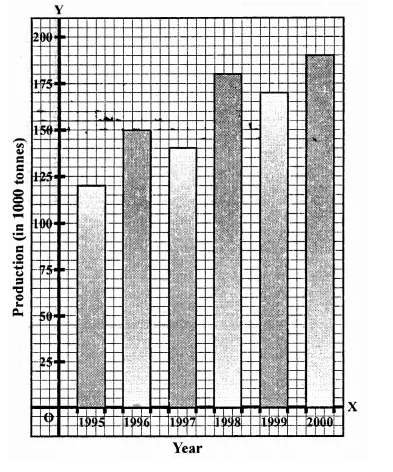
The following data gives the production of foodgrains (in thousand tonnes) for some years:
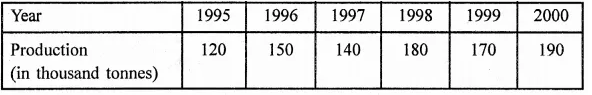
Represent the above data with the help of a bar graph.
Solution:
Question 11.
The following data gives the amount of manure (in thousand tonnes) manufactured by a company during some years:
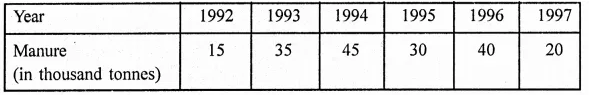
(i) Represent the above data with the help of a bar graph.
(ii) Indicate with the help of the bar graph the year in which the amount of manufactured by the company was maximum.
(in) Choose the correct alternative:
The consecutive years during which there was maximum decrease in manure production are:
(a) 1994 and 1995
(b) 1992 and 1993
(c) 1996 and 1997
(d) 1995 and 1996
Solution:
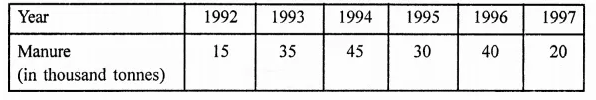
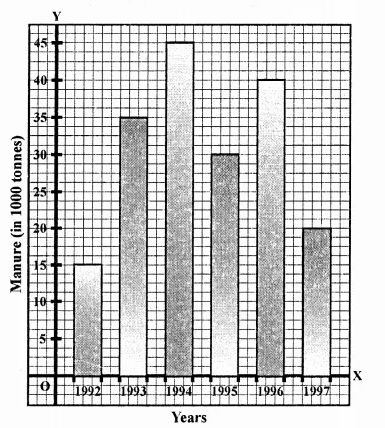
(ii) The maximum amount of manure manufactured in the year 1994, i.e. 45 thousand tonnes.
(iii) There was maximum decrease in manure production in 1996 and 1997.
Question 12.
The following data gives the demand estimates of the Government of India, Department of Electronics for the personnel in the Computer sector during the Eighth Plan period (1990-95):
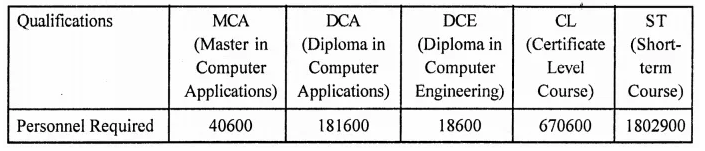
Represent the data with the help of a bar graph. Indicate with the help of the bar graph the course where estimated requirement is least.
Solution:
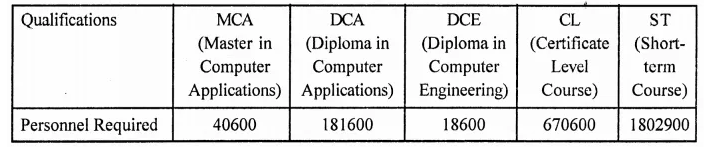
The course where requirement is least is DCE.
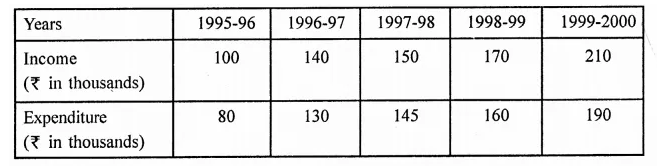
Question 13.
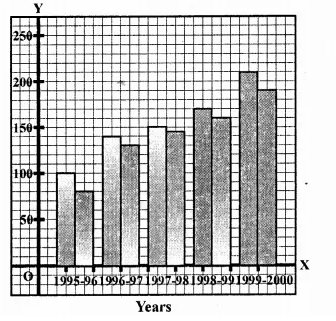
The income and expenditure for 5 years of a family is given in the following data:
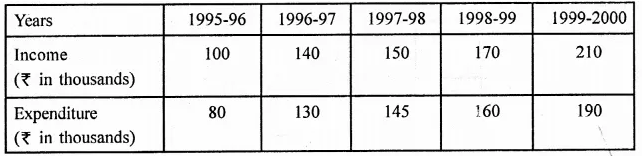
Represent the above data by a bar graph.
Solution:
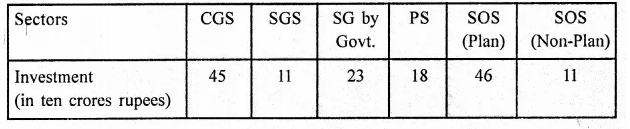
Question 14.
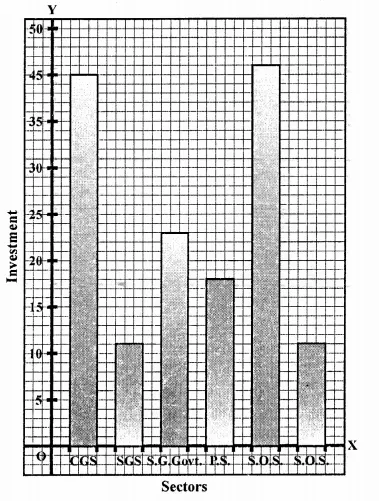
The investment (in ten crores of rupees) of Life Insurance Corporation of India in different sectors are given below:
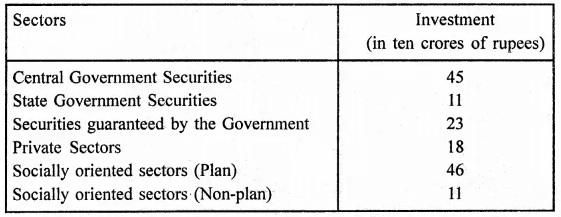
Represent the above data with the help of a bar graph.
Solution:
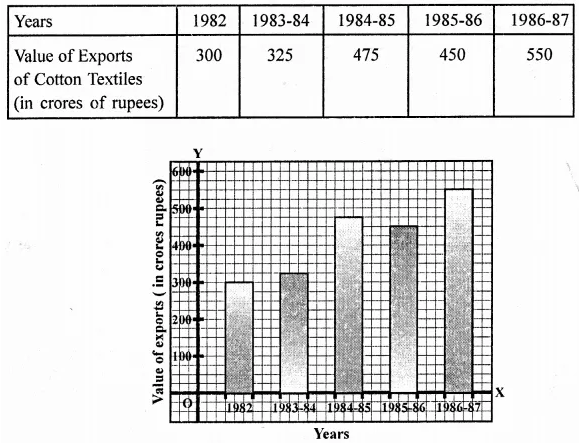
Question 15.
The following data gives the value (in crores of rupees) of the Indian export of cotton textiles for different years:
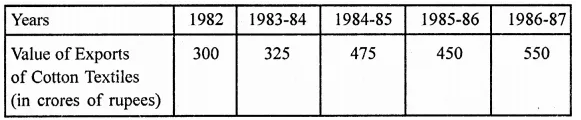
Represent the above data with the help of a bar graph. Indicate with the help of a bar graph the year in which the rate of increase in exports is maximum over the preceding year.
Solution:
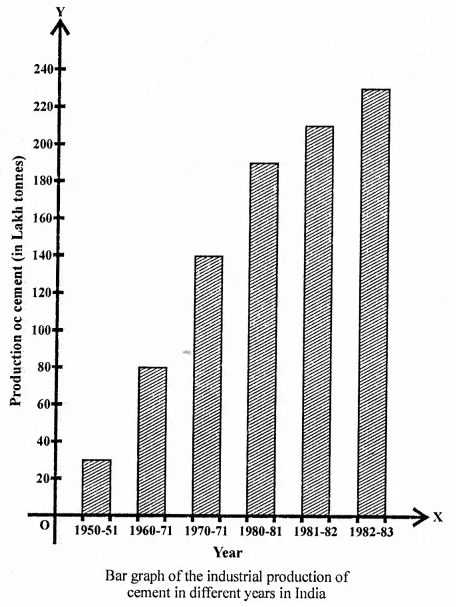
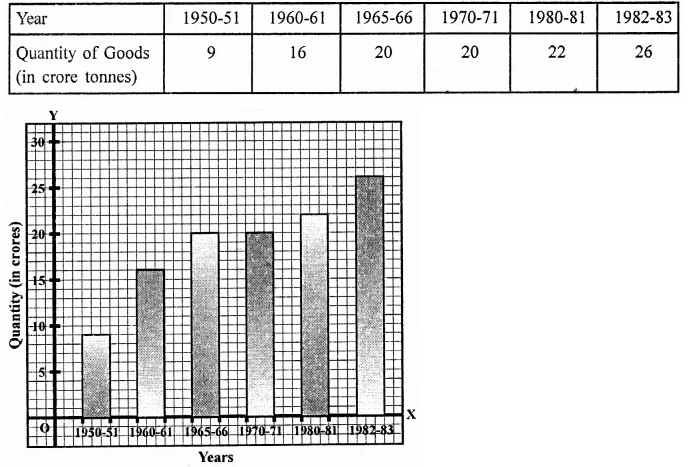
Question 16.
The following table gives the quantity of good (in crore tonnes)
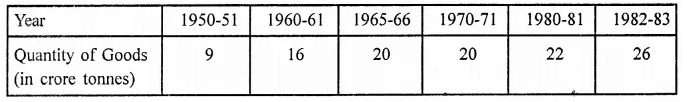
Represent this information with the help of a bar graph.
Explain through the bar graph if the quantity of goods carried by the Indian Railways in 1965-66 is more than double the quantity of goods carried in the year 1950-51.
Solution:
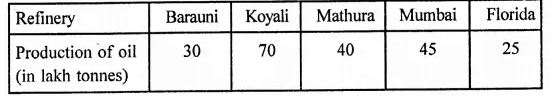
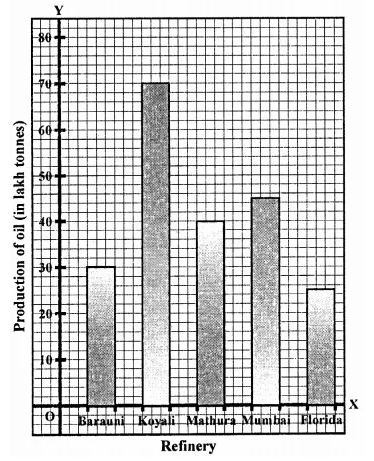
Question 17.
The production of oil (in lakh tonnes) in some of the refineries in India during 1982 was given below:
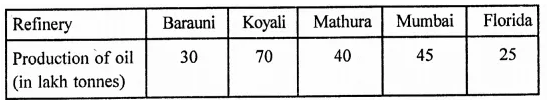
Construct a bar graph to represent the above data so that the bars are drawn horizontally.
Solution:
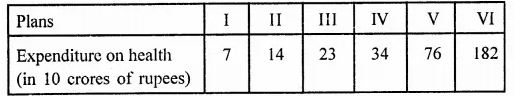
Question 18.
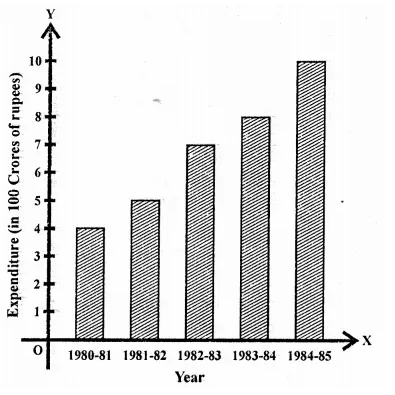
The expenditure (in 10 crores of rupees) on health by the Government of India during the various five year plans is shown below:
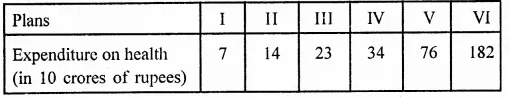
Construct a bar graph to represent the above data.
Solution:
Hope given RD Sharma Class 9 Solutions Chapter 23 Graphical Representation of Statistical Data Ex 23.2 are helpful to complete your math homework.
If you have any doubts, please comment below. Learn Insta try to provide online math tutoring for you.