RS Aggarwal Class 6 Solutions Chapter 2 Factors and Multiples Ex 2A

RS Aggarwal Class 6 Solutions Chapter 2 Factors and Multiples Ex 2A

These Solutions are part of RS Aggarwal Solutions Class 6. Here we have given RS Aggarwal Solutions Class 6 Chapter 2 Factors and Multiples Ex 2A.

Other Exercises

Question 1.
Solution:
(i) A factor of a number is an exact divisor of that number.
Examples : 1. 2 is a factor of 8
2. 5 is a factor of 15
3. 9 is a factor of 27
4. 4 is a factor of 20
5. 3 is a factor of 12.
(ii) Multiple. A number is said to be a multiple of any of its factors.
Examples : 1. 15 is a multiple of 3
2. 8 is a multiple of 4
3. 10 is a multiple of 2
4. 25 is a multiple of 5
5.18 is a multiple of 9.

Question 2.
Solution:
(i) We know that
20 = 1 x 20, 20 = 2 x 10, 20 = 4 x 5
which shows that the numbers 1, 2, 4, 5, 10, 20 exactly divide 20.
1, 2, 4, 5, 10 and 20 are all factors of 20
(ii) We know that
36 = 1 x 36, 36 = 2 x 18, 36 = 3 x 12, 36 = 4 x 9, 36 = 6 x 6
This shows that each of the numbers 1, 2, 3, 4, 6, 9, 12, 18, 36 exactly divides 36.
1, 2, 3, 4, 6, 9, 12, 18, 36 are the factors of 36.
(iii) We know that
60 = 1 x 60, 60 = 2 x 30, 60 = 3 x 20, 60 = 4 x 15, 60 = 5 x 12, 60 = 6 x 10
This shows that each of the numbers 1, 2, 3, 4, 5, 6, 10, 12, 15, 20, 30, 60 exactly divides 60.
1, 2, 3, 4, 5, 6, 10, 12, 15, 20, 30, 60 are all the factors of 60.
(iv) We know that
75 = 1 x 73, 75 = 3 x 25, 75 = 5 x 15
This shows that each of the numbers 1, 3, 5, 15, 25, 75 exactly divides 75.
1, 3, 5, 15, 25, 75 are all the factors of 75.

Question 3.
Solution:
(i) First five multiples of 17 are :
17 x 1 = 17
17 x 2 = 34
17 x 3 = 51
17 x 4 = 68
17 x 5 = 85
(ii) First five multiples of 23 are :
23 x 1 = 23
23 x 2 = 46
23 x 3 = 69
23 x 4 = 92
23 x 5 = 115
(iii) First five multiples of 65 are :
65 x 1 = 65
65 x 2 = 130
65 x 3 = 195
65 x 4 = 260
65 x 5 = 325
(iv) First five multiples of 70 are :
70 x 1 = 70
70 x 2 = 140
70 x 3 = 210
70 x 4 = 280
70 x 5 = 350

Question 4.
Solution:
(i) 32 is a multiple of 2, so it is an even number.
(ii) 37 is not a multiple of 2, so it is an odd number.
(iii) 50 is a multiple of 2, so it is an even number.
(iv) 58 is a multiple of 2, so it is an even number.
(v) 69 is not a multiple of 2, so it is an odd number.
(vi) 144 is a multiple of 2, so it is an even number.
(vii) 321 is not a multiple of 2, so it is an odd number.
(viii) 253 is not a multiple of 2, so it is an odd number.

Question 5.
Solution:
Prime Numbers. Each of the numbers which has exactly two factors, namely 1 and itself, is called a prime number.
Examples. The numbers 2, 3, 5, 7, 11, 13, 17, 19, 23, 29 are all prime numbers.

Question 6.
Solution:
(i) Prime numbers between 10 and 40 are: 11, 13, 17, 19, 23, 29, 31, 37.
(ii) Prime numbers between 80 and 100 are : 83, 89, 97.
(iii) Prime numbers between 40 and 80 are : 41, 43, 47, 53, 59, 61, 67, 71, 73, 79
(iv) Prime numbers between 30 and 40 are : 31, 37.

Question 7.
Solution:
(i) 2 is the smallest prime number.
(ii) 2 is the only even prime number.
(iii) 3 is the smallest odd prime number.

Question 8.
Solution:
(i) We know that
87 = 1 x 87, 87 = 3 x 29
This shows that 1, 3, 29, 87 are the factors of 87.
The number 87 is not a prime number as it has more than 2 factors.
(ii) We have 89 = 1 x 89
The number 89 is a prime number as it has only 2 factors.
(iii) We have 63 = 1 x 63, 63 = 3 x 21,
63 = 7 x 9
This shows that the number 63 has more than 2 factors namely 1, 3, 7, 9, 21,63. So, it is not a prime number.
(iv) We have 91 = 1 x 91, 91 = 7 x 13 This shows that the number 91 has more than 2 factors namely 1, 7, 13, 91.
So, it is not a prime number.

Question 9.
Solution:
From the Sieve of Eratosthenes, we see that the seven consecutive numbers are 90, 91, 92, 93, 94, 95 and 96

Question 10.
Solution:
(i) There is no counting number having no factor at all.
(ii) The number 1 has exactly one factor.
(iii) The numbers between 1 and 100 having exactly three factors are : 4, 9, 25, 49.

Question 11.
Solution:
Composite Numbers. Numbers having more than two factors are called composite numbers. A composite number can be an odd number. The smallest odd composite number is 9.

Question 12.
Solution:
Twin-primes. Two consecutive odd prime numbers are known as twin- primes.
The prime numbers between 50 and 100 are:
53, 59, 61, 67, 71, 73, 79, 83, 89, 97
From above pairs of twin-primes are (59, 61), (71, 73)

Question 13.
Solution:
Co-primes. Two numbers are said to
be co-prime if they do not have a common factor.
Examples. Five pairs of co-primes are:
(i) 2, 3
(ii) 3, 4
(iii) 4, 5
(iv) 8, 15
(v) 9, 16
Co-primes are not always prime.
Illustration. In the pair (3, 4) of co-primes, 3 is a prime number whereas 4 is a composite number.

Question 14.
Solution:
(i) 36 = 7 + 29
(ii) 42 = 5 + 37
(iii) 84= 17 + 67
(iv) 98 = 19 + 79

Question 15.
Solution:
(i) 31 = 5 + 7 + 19
(ii) 35 = 5 + 7 + 23
(iii) 49 = 3 + 5 + 41
(iv) 63 = 7+ 13 +43

Question 16.
Solution:
(i) 36 = 17 + 19
(ii) 84 = 41 + 43
(iii) 120 = 59 + 61
(iv) 144 = 71+73

Question 17.
Solution:
(i) to (iv). None of the given statements is true.


Hope given RS Aggarwal Solutions Class 6 Chapter 2 Factors and Multiples Ex 2A are helpful to complete your math homework.

If you have any doubts, please comment below. Learn Insta try to provide online math tutoring for you.

RS Aggarwal Class 6 Solutions Chapter 1 Number System Ex 1H

RS Aggarwal Class 6 Solutions Chapter 1 Number System Ex 1H

These Solutions are part of RS Aggarwal Solutions Class 6. Here we have given RS Aggarwal Solutions Class 6 Chapter 1 Number System Ex 1H

Other Exercises

Objective questions
Mark against the correct answer in each of the following

Question 1.
Solution:
(c) Place value of 6 in 48632950 is 600000

Question 2.
Solution:
(a) Face value of 4 in the numeral 89247605 is 4
(∴ Face value does not alter)

Question 3.
Solution:
(c) The place of 5 in the numeral 78653421 is 50000 and face value is 5
∴ Difference between 50000 and 5 = 49995

Question 4.
Solution:
(b) The smallest counting number is 1

Question 5.
Solution:
(b) 4-digit numbers are 1000 to 9999
=> 9999 – 999
= 9000

Question 6.
Solution:
(b) 7-digit numbers are from 1000000 to 9999999 or 9999999 – 999999
= 9000000

Question 7.
Solution:
(c) 8-digit numbers are to 99999999 99999999 – 9999999
= 90000000

Question 8.
Solution:
The number before 1000000 will be 1000000 – 1 = 999999 (b)

Question 9.
Solution:
(a) VX is not meaningful as V does not come before X

Question 10.
Solution:
(c) IC is not meaningful as I comes before V and X only

Question 11.
Solution:
(b) XVV is not meaningful as V does not comes more than once.

Hope given RS Aggarwal Solutions Class 6 Chapter 1 Number System Ex 1H are helpful to complete your math homework.

If you have any doubts, please comment below. Learn Insta try to provide online math tutoring for you.

RS Aggarwal Class 6 Solutions Chapter 1 Number System Ex 1G

RS Aggarwal Class 6 Solutions Chapter 1 Number System Ex 1G

These Solutions are part of RS Aggarwal Solutions Class 6. Here we have given RS Aggarwal Solutions Class 6 Chapter 1 Number System Ex 1G

Other Exercises

Question 1.
Solution:
(i) 2 = II
(ii) 8 = VIII
(iii) 14 = XIV
(iv) 29 = XXIX
(v) 36= XXXVI
(vi) 43 = XLIII
(vii) 54 = LIV
(viii) 61 = LXI
(ix) 73 = LXXIII
(x) 81 = LXXXI
(xi) 91 = XCI
(xii) 95 XCV
(xiii) 99= XCIX
(xiv) 105 CV
(xv) 114 = CXIV

Question 2.
Solution:
(i) 164 = CLXIV
(ii) 195 = CXCV
(iii) 226 = CCXXVI
(iv) 341 = CCCXLI
(v) 475 = CDLXXV
(vi) 596 = DXCVI
(vii) 611 = DCXI
(viii) 759 = DCCLIX

Question 3.
Solution:
(i) XXVII = 27
(ii) XXXIV = 34
(iii) XLV = 45
(iv) LIV = 54
(v) LXXIV = 74
(vi) XCI = 91
(vii) XCVI = 96
(viii) CXI = 111
(ix) CLIV = 154
(x) CCXXIV = 224
(xi) CCCLXV = 365
(xii) CDXIV = 414
(xiii) CDLXIV = 464
(xiv) DVI = 506
(xv) DCCLXVI = 766

Question 4.
Solution:
(i) V is never subtracted
∴ VC is wrong
(ii) I can be subtracted from V and X only
∴ IL is wrong
(iii) V, L, D are never repeated
∴ VVII is wrong
(iv) IX cannot occur to the left of X
∴ IXX is wrong

Hope given RS Aggarwal Solutions Class 6 Chapter 1 Number System Ex 1G are helpful to complete your math homework.

If you have any doubts, please comment below. Learn Insta try to provide online math tutoring for you.
RD Sharma Class 8 Solutions Chapter 27 Introduction to Graphs Ex 27.2

RD Sharma Class 8 Solutions Chapter 27 Introduction to Graphs Ex 27.2

These Solutions are part of RD Sharma Class 8 Solutions. Here we have given RD Sharma Class 8 Solutions Chapter 27 Introduction to Graphs Ex 27.2

Other Exercises

Question 1.
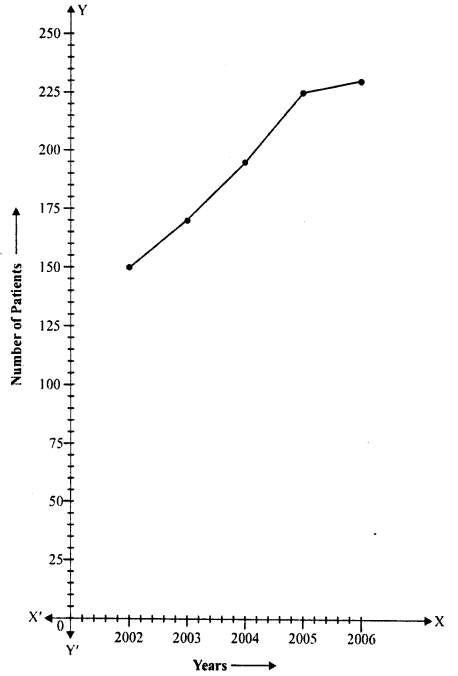
The following table shows the number of patients discharged from a hospital with HIV diagnosis in different years :
RD Sharma Class 8 Solutions Chapter 27 Introduction to Graphs Ex 27.2 1
Represent this information by a graph.
Solution:
Represent years along x-axis and number of patients along y-axis. Now, plot the points (2002, 150), (2003, 170), (2004, 195), (2005, 225) and (2006, 230) on the graph and join them in order. We get the required graph as shown on the graph.
RD Sharma Class 8 Solutions Chapter 27 Introduction to Graphs Ex 27.2 2

Question 2.
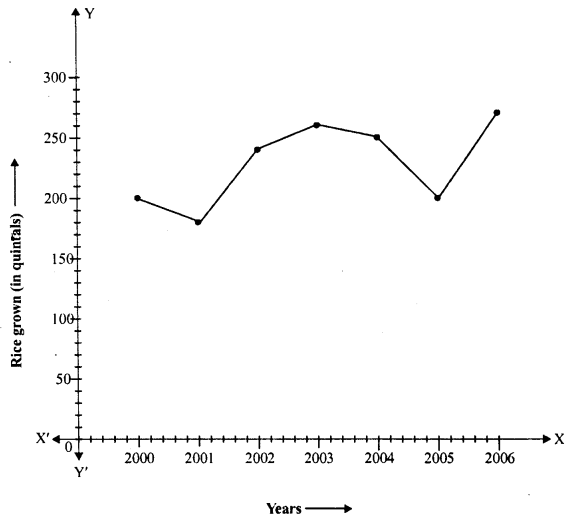
The following table shows the amount of rice grown by a farmer in different years :
RD Sharma Class 8 Solutions Chapter 27 Introduction to Graphs Ex 27.2 3
Plot a graph to illustrate this information.
Solution:
We represent years along x-axis and rice (in quintals) along y-axis. Now we plot the points (2000,200), (2001, 180), (2002,240), (2003,260), (2004,250), (2005,200) and (2006,270) on the graph and join them in order as shown on the graph.
RD Sharma Class 8 Solutions Chapter 27 Introduction to Graphs Ex 27.2 4

Question 3.
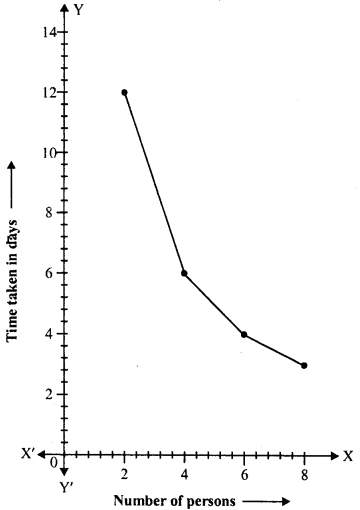
The following table gives the information regarding the number of persons employed to a piece of work and time taken to complete the work:
RD Sharma Class 8 Solutions Chapter 27 Introduction to Graphs Ex 27.2 5
Plot a graph of this information.
Solution:
We represent number of person along x-axis and time taken in day along y-axis. Now plot the points (2,12), (4,6), (6,4) and (8, 3) on the graph and join them in order as shown on the graph.
RD Sharma Class 8 Solutions Chapter 27 Introduction to Graphs Ex 27.2 6

Question 4.
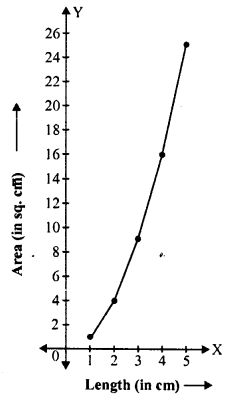
The following table gives the information regarding length of a side of a square and its area :
RD Sharma Class 8 Solutions Chapter 27 Introduction to Graphs Ex 27.2 7
Draw a graph to illustrate this information.
Solution:
We represent length of a side (in cm) along x-axis and Area of square (in cm2) along the y-axis. Now plot the points (1,1), (2, 4), (3, 9), (4, 16) and (5, 25) on the graph and join them in order. We get the required graph as shown on the graph.
RD Sharma Class 8 Solutions Chapter 27 Introduction to Graphs Ex 27.2 8

Question 5.
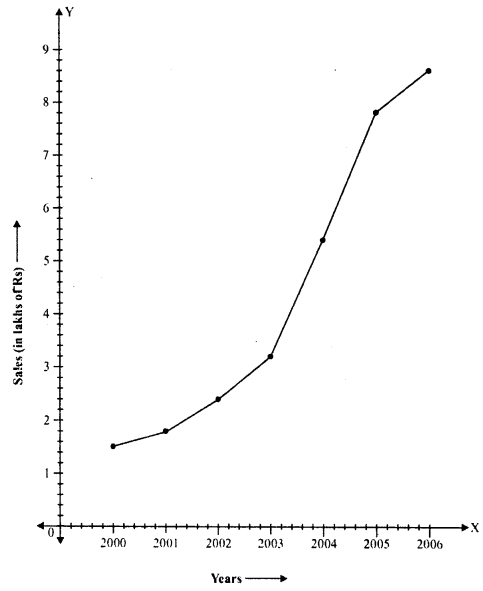
The following table shows the sales of a commodity during the years 2000 to 2006.
RD Sharma Class 8 Solutions Chapter 27 Introduction to Graphs Ex 27.2 9
Draw a graph of this information.
Solution:
We represent years on x-axis and sales (in lakh rupees) along y-axis. Now plot the points
(2000, 1.5), (2001, 1.8), (2002, 2.4), (2003, 3.2), (2004, 5.4), (2005, 7.8) and (2006, 8.6) on the graph and join them in order we get the required graph as shown.
RD Sharma Class 8 Solutions Chapter 27 Introduction to Graphs Ex 27.2 10

Question 6.
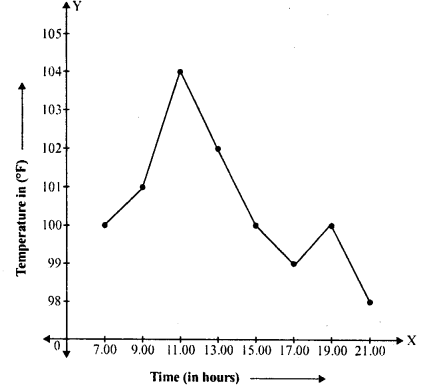
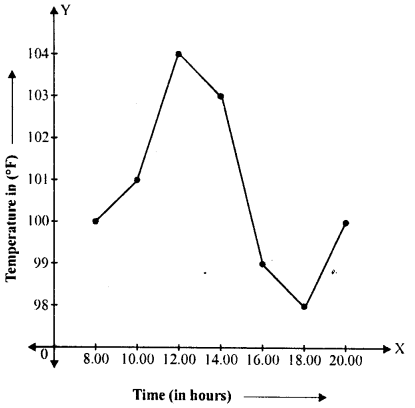
Draw the temperature-time graph in each of the following cases :
RD Sharma Class 8 Solutions Chapter 27 Introduction to Graphs Ex 27.2 11
Solution:
(i) We represent time along x-axis and temperature (in °F) alongy-axis. Now plot the points (7:00, 100), (9:00, 101), (11:00, 104), (13:00, 102), (15:00, 100), (17:00, 99), (19:00, 100) and (21:00, 98) on the graph and join them in order to get the required graph as shown on the graph.
RD Sharma Class 8 Solutions Chapter 27 Introduction to Graphs Ex 27.2 12
RD Sharma Class 8 Solutions Chapter 27 Introduction to Graphs Ex 27.2 13
(ii) We represent time along x-axis and temperature (in °F) along j-axis. Now plot the points (8:00, 100), (i0:00, 101), (12:00, 104), (14:00, 103), (16:00, 99), (18:00,98), (20:00,100) on the graph and join them in order to get the required graph as shown on the graph.
RD Sharma Class 8 Solutions Chapter 27 Introduction to Graphs Ex 27.2 14

Question 7.
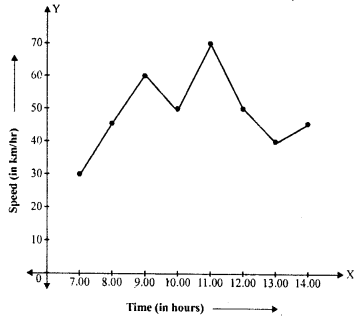
Draw the velocity-time graph from the following data :
RD Sharma Class 8 Solutions Chapter 27 Introduction to Graphs Ex 27.2 15
Solution:
We represent time (in hours) along x- axis and speed (in km/hr) along y-axis. Now plot the points (7:00,30), (8:00,45), (9:00,60), (10:00, 50), (11:00, 70), (12:00, 50), (13:00, 40) and (14:00,45) on the graph and join them in order to get the required graph as shown.
RD Sharma Class 8 Solutions Chapter 27 Introduction to Graphs Ex 27.2 16

Question 8.
The runs scored by a cricket team in first 15 overs are given below :
RD Sharma Class 8 Solutions Chapter 27 Introduction to Graphs Ex 27.2 17
Draw the graph representing the above data in two different ways as a graph and as a bar chart.
Solution:
We represent overs along.t-axis and runs along v-axis. Now plot the points (1,2), (II, 1), (III, 4), (IV, 2), (V, 6), (VI, 8), (VII, 10), (VIII, 21), (IX, 5), (X, 8), (XI, 3), (XII, 2), (XIII, 6), (XIV, 8), (XV, 12) on the graph and join them to get the graph, as shown bar graph of the given data is given below:
RD Sharma Class 8 Solutions Chapter 27 Introduction to Graphs Ex 27.2 18
RD Sharma Class 8 Solutions Chapter 27 Introduction to Graphs Ex 27.2 19

Question 9.
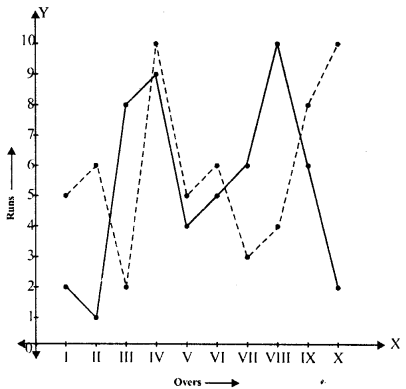
The runs scored by two teams A and B in first 10 overs are given below :
RD Sharma Class 8 Solutions Chapter 27 Introduction to Graphs Ex 27.2 20
Draw a graph depicting the data, making the graphs on the same axes in each case in two different ways as a graph and as a bar chart.
Solution:
We represent overs along x-axis and runs scored by team A and team B with different types of lines along y-axis.
Plot the points for team A : (I, 2), (II, 1), (III,8), (IV, 9), (V, 4), (VI, 5), (VII, 6), (VIII, 10), (IX, 6) and (X, 2)
and for team B, the points will be : (I, 5), (II, 6), (III, 2), (IV, 10), (V, 5), (VI, 6), (VII, 3), (VIII, 4), (IX, 8), (X, 10).
Then join them in order to get the required graph for team A and team B as shown.
Note : For team A ………
for team B …………
RD Sharma Class 8 Solutions Chapter 27 Introduction to Graphs Ex 27.2 21

Hope given RD Sharma Class 8 Solutions Chapter 27 Introduction to Graphs Ex 27.2 are helpful to complete your math homework.

If you have any doubts, please comment below. Learn Insta try to provide online math tutoring for you.

RS Aggarwal Class 6 Solutions Chapter 1 Number System Ex 1F

RS Aggarwal Class 6 Solutions Chapter 1 Number System Ex 1F

These Solutions are part of RS Aggarwal Solutions Class 6. Here we have given RS Aggarwal Solutions Class 6 Chapter 1 Number System Ex 1F

Other Exercises

Find the estimated quotient for each of the following :

Question 1.
Solution:
87 ÷ 28
87 is estimated to the nearest ten = 90
28 is estimated to the nearest ten = 30
∴ 90 ÷ 30
= 3 Ans.

Question 2.
Solution:
83 ÷ 17
83 is estimated to the nearest ten = 80
17 is estimated to the nearest ten = 20
∴ 80 ÷ 20
= 4 Ans.

Question 3.
Solution:
75 ÷ 23
75 is estimated to the nearest ten = 80
23 is estimated to the nearest ten = 20
∴ 80 ÷ 20
= 4 Ans.

Question 4.
Solution:
193 ÷ 24
193 is estimated to the nearest ten = 200
24 is estimated to the nearest ten = 20
∴ 200 ÷ 20
= 10 Ans.

Question 5.
Solution:
725 ÷ 23
725 is estimated to the nearest hundred = 700
23 is estimated to the nearest ten = 20
∴700 ÷ 20
= 35 Ans.

Question 6.
Solution:
275 ÷ 25
275 is estimated to the nearest hundred = 300
25 is estimated to the nearest ten = 30
∴ 300 ÷ 30
= 10 Ans.

Question 7.
Solution:
633 ÷ 33
633 is estimated to the nearest hundred = 600
33 is estimated to the nearest ten = 30
∴ 600 ÷ 30
= 20 Ans.

Question 8.
Solution:
729 ÷ 29
729 is estimated to the nearest hundred = 700
29 is estimated to the nearest ten = 30
∴ 700 ÷ 30
= 70 ÷ 3
= 23 (approximately) Ans.

Question 9.
Solution:
858 ÷ 39
858 is estimated to the nearest hundred = 900
39 is estimated to the nearest ten = 40
∴ 900 ÷ 40
= 90 ÷ 4
= 23 (approximately) Ans

Question 10.
Solution:
868 ÷ 38
868 is estimated to the nearest hundred = 900
38 is estimated to the nearest ten = 40
∴ 900 ÷ 40
= 90 ÷ 4
= 23 (approximately) Ans.

Hope given RS Aggarwal Solutions Class 6 Chapter 1 Number System Ex 1F are helpful to complete your math homework.

If you have any doubts, please comment below. Learn Insta try to provide online math tutoring for you.
RD Sharma Class 8 Solutions Chapter 27 Introduction to Graphs Ex 27.1

RD Sharma Class 8 Solutions Chapter 27 Introduction to Graphs Ex 27.1

These Solutions are part of RD Sharma Class 8 Solutions. Here we have given RD Sharma Class 8 Solutions Chapter 27 Introduction to Graphs Ex 27.1

Other Exercises

Question 1.
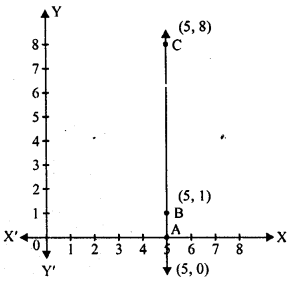
Plot the points (5,0 ), (5,1), (5, 8). Do they lie on a line ? What is your observation ?
Solution:
Draw XOX’ and YOY’ the co-ordinates axis on the graph.
Take 1 cm = 1 unit
Point A (5, 0), B (5, 1) and C (5, 8) have been plotted on the graph. By joining A, B and C, we see that these points lie on the same line which is 5 units from y-axis.
RD Sharma Class 8 Solutions Chapter 27 Introduction to Graphs Ex 27.1 1

Question 2.
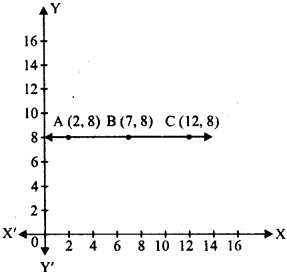
Plot the points (2, 8), (7, 8) and (12, 8). Join these points in pairs. Do they lie on a line ? What do you observe ?
Solution:
Draw XOX’ and YOY’, the co-ordinate axis on the graph.
Take 0.5 cm = 1 unit.
Now points A (2, 8), B (7, 8), and C (12, 8) have been plotted on the graph. By joining them, we see that these points lie on the same line which is at a distance of 8 unit from x-axis.
RD Sharma Class 8 Solutions Chapter 27 Introduction to Graphs Ex 27.1 2

Question 3.
Locate the points :
(i) (1,1), (1,2), (1,3), (1,4)
(ii) (2,1), (2, 2), (2,3), (2,4)
(iii) (1,3), (2,3), (3,3), (4,3)
(iv) (1,4), (2,4), (3,4), (4,4).
Solution:
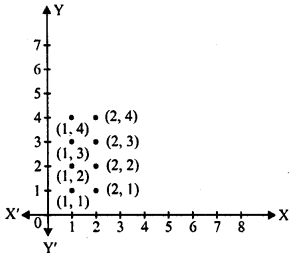
The points given in (i) and (ii) are locates in first graph.
RD Sharma Class 8 Solutions Chapter 27 Introduction to Graphs Ex 27.1 3
(i) (1,1), (1,2), (1,3), (1,4)
(ii) (2,1), (2, 2), (2, 3), (2, 4)
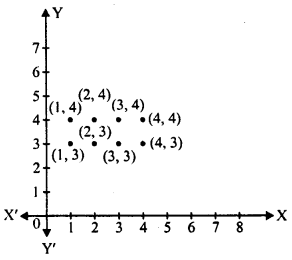
Points of (iii) and (iv) are located in the adjoining graph.
(iii) (1, 3), (2, 3), (3, 3), (4, 3)
(iv) (1,4), (2, 4), (3, 4), (4,4)
RD Sharma Class 8 Solutions Chapter 27 Introduction to Graphs Ex 27.1 4

Question 4.
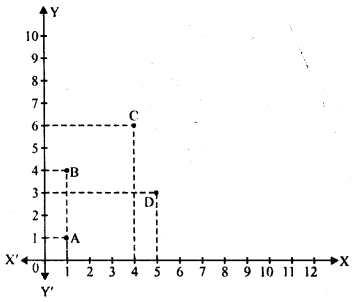
Find the coordinates of points A, B, C, D in the figure
RD Sharma Class 8 Solutions Chapter 27 Introduction to Graphs Ex 27.1 5
Solution:
Draw perpendicular from A, B, C and D on x-axis and also on y-axis.
A is 1 unit from y-axis and 1 unit from x-axis.
∴ Co-ordinates of A are (1,1)
B is 1 unit fr onr y-axis and 4 units from x-axis
∴ Co-ordinates of B are (1,4)
C is 4 units from y-axis and 6 units from x-axis
∴ Co-ordinates of C are (4, 6)
D is 5 units fromy-axis and 3 units from x-axis
∴ Co-ordinates of D are (5,3)

Question 5.
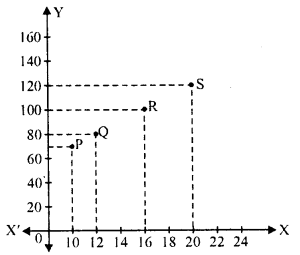
Find the coordinates of points P, Q, R and S in Fig.
RD Sharma Class 8 Solutions Chapter 27 Introduction to Graphs Ex 27.1 6

Solution:
Through P, Q, R and S, draw perpendiculars on x-axis and also on y-axis.
(i) P is 10 units form >’-axis and 70 units from y-axis
∴ Co-ordinates of P are (10, 70)
(ii) Q is 12 unit from x-axis and 80 units from y-axis
∴ Co-ordinates of Q are (12, 80)
(iii) R is 16 units from x-axis and 100 units from y-axis
∴ Co-ordinates of R are (16, 100)
(iv) S is 20 units from x-axis and 120 units from y-axis
∴ Co-ordinates of S are (20, 120)

Question 6.
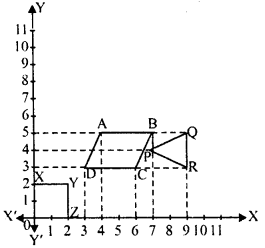
Write the coordinates of each of the vertices of each polygon in the figure.
RD Sharma Class 8 Solutions Chapter 27 Introduction to Graphs Ex 27.1 7
Solution:
(i) In figure OXYZ
Co-ordinates of O are (0, 0) ∵It is the origin
Co-ordinates of X are (0, 2) ∵ It lies on y – axis
Co-ordinates of Y are (2, 2)
Co-ordinates of Z are (2, 0) ∵It lies on x-axis
(ii) In figure ABCD, draw perpendicular from A, B, C, D on x-axis and y-axis.
A is 4 unit from y-axis and 5 units from x- axis
∴ Co-ordinates of A are (4, 5)
B is 7 units from y-axis and 5 units from x – axis
∴ Co-ordinates of B are (7, 5)
C is 6 units from y-axis and 3 units from x- axis
∴ Co-ordinates of C are (6, 3)
D is 3 units from y-axis as well x-axis
∴ Co-ordinates of D are (3, 3)
(iii) In figure PQR, perpendiculars for P, Q, R are drawn on x-axis and also on y-axis.
∴ Co-ordinates of P are (7, 4), of Q are (9, 5) and of R are (9, 3).

Question 7.
Decide which of the following statements is true and which is false. Give reasons for your answer.
(i) A point whose x-coordinate is zero, will lie on they-axis.
(ii) A point whose y-coordinate is zero, will lie on x-axis.
(iii) The coordinates of the origin are (0, 0).
(iv) Points whose x and y coordinates are equal, lie on a line passing through the origin.
Solution:
(i) Correct: ∵ every point on y-axis, its x = 0
(ii) Correct: ∵ every point on x-axis, its y = 0
(iii) Correct
(iv) Correct

Hope given RD Sharma Class 8 Solutions Chapter 27 Introduction to Graphs Ex 27.1 are helpful to complete your math homework.

If you have any doubts, please comment below. Learn Insta try to provide online math tutoring for you.

RS Aggarwal Class 6 Solutions Chapter 1 Number System Ex 1E

RS Aggarwal Class 6 Solutions Chapter 1 Number System Ex 1E

These Solutions are part of RS Aggarwal Solutions Class 6. Here we have given RS Aggarwal Solutions Class 6 Chapter 1 Number System Ex 1E

Other Exercises

Estimate each of the following products by rounding off each number to the nearest ten.

Question 1.
Solution:
(38 x 63)
38 estimated to the nearest ten = 40
63 estimated to the nearest ten = 60
∴ 40 x 60
= 2400 Ans.

Question 2.
Solution:
(54 x 47)
54 estimated to the nearest ten = 50
47 estimated to the nearest ten = 50
∴ 50 x 50
= 2500 Ans.

Question 3.
Solution:
(28 x 63)
28 estimated to the nearest ten = 30
63 estimated to the nearest ten = 60
∴ 30 x 60
= 1800 Ans.

Question 4.
Solution:
(42 x 75)
42 estimated to the nearest ten = 40
75 estimated to the nearest ten = 80
∴ 40 x 80
= 3200 Ans.

Question 5.
Solution:
(64 x 58)
64 estimated to the nearest ten = 60
58 estimated to the nearest ten = 60
∴ 60 x 60
= 3600 Ans.

Question 6.
Solution:
(15 x 34)
15 estimated to the nearest ten = 20
34 estimated to the nearest ten = 30
∴ 20 x 30
= 600 Ans.

Estimate each of the following products by rounding off each number to the nearest hundred :

Question 7.
Solution:
(376 x 123)
376 estimated to the nearest hundred = 400
123 estimated to the nearest hundred = 100
∴ 400 x 100
= 40000 Ans.

Question 8.
Solution:
(264 x 147)
264 estimated to the nearest hundred = 300
147 estimated to the nearest hundred = 100
∴ 300 x 100
= 30000 Ans.

Question 9.
Solution:
423 x 158)
423 estimated to the nearest hundred = 400
158 estimated to the nearest hundred = 200
∴ 400 x 200
= 80000 Ans.

Question 10.
Solution:
(509 x 179)
509 estimated to the nearest hundred = 500
179 estimated to the nearest hundred = 200
∴ 500 x 200
= 100000 Ans.

Question 11.
Solution:
(392 x 138)
392 estimated to the nearest hundred = 400
138 estimated to the nearest hundred = 100
∴ 400 x 100
= 40000 Ans.

Question 12.
Solution:
(271 x 339)
271 estimated to the nearest hundred = 300
339 estimated to the nearest hundred = 300
∴ 300 x 300
= 90000 Ans.

Estimate each of the following products by rounding off the first number upwards and the second number downwards:

Question 13.
Solution:
(183 x 154)
183 is rounded off upwards = 200
154 is rounded off downwards = 100
∴ 200 x 100
= 20000 Ans.

Question 14.
Solution:
(267 x 146)
267 is rounded off upwards = 300
146 is rounded off downwards = 100
∴ 300 x 100
= 30000 Ans.

Question 15.
Solution:
(359 x 76)
359 is rounded off upwards = 400
76 is rounded off downwards = 70
∴ 400 x 70
= 28000 Ans.

Question 16.
Solution:
(472 x 158)
472 is rounded off upwards = 500
158 is rounded off downwards = 100
∴ 500 x 100
= 50000 Ans.

Question 17.
Solution:
(680 x 164)
680 is rounded off upwards = 700
164 is rounded off downwards = 100
∴ 700 x 100
= 70000 Ans.

Question 18.
Solution:
(255 x 350)
255 is rounded off upwards = 300
350 is rounded off downwards = 300
∴ 300 x 300
= 90000 Ans.

Estimate each of the following products by rounding off the first number downwards and the second number upwards:

Question 19.
Solution:
(356 x 278)
356 is rounded off downwards = 300
278 is rounded off upwards = 300
∴ 300 x 300
= 90000 Ans.

Question 20.
Solution:
(472 x 76)
472 is rounded off downwards = 400
76 is rounded off upwards = 80
∴ 400 x 80
= 32000 Ans.

Question 21.
Solution:
(578 x 369)
578 is rounded off downwards = 500
369 is rounded off upwards = 400
∴ 500 x 400
= 200000 Ans.

Hope given RS Aggarwal Solutions Class 6 Chapter 1 Number System Ex 1E are helpful to complete your math homework.

If you have any doubts, please comment below. Learn Insta try to provide online math tutoring for you.
RS Aggarwal Class 6 Solutions Chapter 1 Number System Ex 1D

RS Aggarwal Class 6 Solutions Chapter 1 Number System Ex 1D

These Solutions are part of RS Aggarwal Solutions Class 6. Here we have given RS Aggarwal Solutions Class 6 Chapter 1 Number System Ex 1D

Other Exercises

Question 1.
Solution:
(a) 40
(b) 170
(c) 3870
(d) 16380

Question 2.
Solution:
(a) 800
(b) 1300
(c) 43100
(d) 98200

Question 3.
Solution:
(a) 1000
(b) 5000
(c) 17000
(d) 28000

Question 4.
Solution:
(a) 20000
(b) 30000
(c) 30000
(d) 270000

Estimate each sum to the nearest ten :

Question 5.
Solution:
(57 + 34)
57 estimated to the nearest ten = 60
34 estimated to the nearest ten = 30
Required sum = 60 + 30
= 90 Ans.

Question 6.
Solution:
(43 + 78)
43 estimated to the nearest ten = 40
78 estimated to the nearest ten = 80
Required sum = 40 + 80
= 120 Ans.

Question 7.
Solution:
(14 + 69)
14 estimated to the nearest ten = 10
69 estimated to the nearest ten = 70
Required sum = 10 + 70
= 80 Ans.

Question 8.
Solution:
(86 +19)
86 estimated to the nearest ten = 90
19 estimated to the nearest ten = 20
Required sum = 90 + 20
= 110 Ans.

Question 9.
Solution:
(95 + 58)
95 estimated to the nearest ten =100
58 estimated to the nearest ten = 60
Required sum = 100 + 60
= 160 Ans

Question 10.
Solution:
77 estimated to the nearest ten = 80
63 estimated to the nearest ten = 60
Required sum = 80 + 60
= 140 Ans.

Question 11.
Solution:
(356 + 275)
356 estimated to the nearest ten = 360
275 estimated to the nearest ten = 280
Required sum = 360 + 280
= 640 Ans.

Question 12.
Solution:
463 + 182
463 estimated to the nearest ten = 460
182 estimated to the nearest ten = 180
Required sum = 460 + 180
= 640 Ans.

Question 13.
Solution:
(538 + 276)
538 estimated to the nearest ten = 540
276 estimated to the nearest ten = 280
Required sum = 540 + 280
= 820 Ans.

Estimate each sum to the nearest hundred:

Question 14.
Solution:
(236 + 689)
236 estimated to the nearest hundred = 200
689 estimated to the nearest hundred = 700
Required sum = 200 + 700
= 900 Ans.

Question 15.
Solution:
(458 + 324)
458 estimated.to the nearest hundred = 500
324 estimated to the nearest hundred = 300
Required sum = 500 + 300
= 800 Ans.

Question 16.
Solution:
(170 + 395)
170 estimated to the nearest hundred = 200
395 estimated to the nearest hundred = 400
Required sum = 200 + 400
= 600 Ans.

Question 17.
Solution:
(3280 + 4395)
3280 estimated to the nearest hundred = 3300
4395 estimated to the nearest hundred = 4400
Required sum = 3300 + 4400
= 7700 Ans.

Question 18.
Solution:
(5130 + 1410)
5130 estimated to the nearest hundred = 5100
1410 estimated to the nearest hundred = 1400
Required sum = 5100 + 1400
= 6500 Ans.

Question 19.
Solution:
(10083 + 29380)
10083 estimated to the nearest hundred =10100
29380 estimated to the nearest hundred = 29400
Required sum = 10100 + 29400
= 39500 Ans.

Estimate each sum to the nearest thousand :

Question 20.
Solution:
(32836 + 16466)
32836 estimated to the nearest thousand = 33000
16466 estimated to the nearest thousand = 16000
Required sum = 33000 + 16000
= 49000 Ans.

Question 21.
Solution:
(46703 + 11375)
46703 estimated to the nearest thousand = 47000
11375 estimated to the nearest thousand = 11000
Required sum = 47000 + 11000
= 58000 Ans.

Question 22.
Solution:
54 balls + 79 balls
54 balls estimated to the nearest 10 = 50
79 balls estimated to the nearest 10 = 80
Required total number of balls = 50 + 80 + 130 Ans.

Estimate each difference to the nearest ten :

Question 23.
Solution:
(53 – 18)
53 estimated to the nearest ten = 50
18 estimated to the nearest ten = 20
Difference of 50 and 20
= 50 – 20
= 30 Ans.

Question 24.
Solution:
(97 – 38)
97 estimated to the nearest ten =100
38 estimated to the nearest ten = 40
Difference of 100 and 40
= 100 – 40
= 60 Ans.

Question 25.
Solution:
(409 – 148)
409 estimated to the nearest ten = 410
148 estimated to the nearest ten = 150
Difference of 410 and 150
= 410 – 150
= 260 Ans.

Estimate each difference to the nearest hundred :

Question 26.
Solution:
(678 – 215)
678 estimated to the nearest hundred = 700
215 estimated to the nearest hundred = 200
Difference between 700 and 200
= 700 – 200
= 500 Ans.

Question 27.
Solution:
(957 – 578)
957 estimated to the nearest hundred = 1000
578 estimated to the nearest hundred = 600
Difference between 1000 and 600
= 1000 – 600
= 400 Ans.

Question 28.
Solution:
(7258 – 2429)
7258 estimated to the nearest hundred = 7300
2429 estimated to the nearest hundred = 2400
Difference between 7300 and 2400
= 7300 – 2400
= 4900 Ans.

Question 29.
Solution:
5612 estimated to the nearest hundred = 5600
3095 estimated to the nearest hundred = 3100
Difference between 5600 and 3100
= 5600 – 3100
= 2500 Ans.

Estimate each difference to the nearest thousand :

Question 30.
Solution:
35863 estimated to the nearest thousand = 36000
27677 estimated to the nearest thousand = 28000
Difference between 36000 and 28000
= 36000 – 28000
= 8000 Ans.

Question 31.
Solution:
(47005 – 39488)
47005 estimated to the nearest thousand = 47000
39488 estimated to the nearest thousand = 39000
Difference between 47000 and 39000
= 47000 – 39000
= 8000 Ans.

Hope given RS Aggarwal Solutions Class 6 Chapter 1 Number System Ex 1D are helpful to complete your math homework.

If you have any doubts, please comment below. Learn Insta try to provide online math tutoring for you.

RD Sharma Class 9 Solutions Chapter 23 Graphical Representation of Statistical Data MCQS

RD Sharma Class 9 Solutions Chapter 23 Graphical Representation of Statistical Data MCQS

These Solutions are part of RD Sharma Class 9 Solutions. Here we have given RD Sharma Class 9 Solutions Chapter 23 Graphical Representation of Statistical Data MCQS

Other Exercises

Question 1.
Which one of the following is not the graphical representation of statistical data:
(a) Bar graph
(b) Histogram
(c) Frequency polygon
(d) Cumulative frequency distribution
Solution:
Cumulative frequency distribution is not a graphical method.

Question 2.
In a frequency distribution, ogives are graphical representation of
(a) Frequency
(b) Relative frequency
(c) Cumulative
(d) Raw data
Solution:
Ogive is the graphical representation of cumulative frequency.

Question 3.
A frequency polygon is constructed by plotting frequency of the class interval and the
(a) upper limit of the class
(b) lower limit of the class
(c) mid value of the class
(d) any values of the class
Solution:
A frequency polygon is constructed by plotting frequency of the class interval and mid value of the class.

Question 4.
In a histogram the area of each rectangle is proportional to
(a) the class mark of the corresponding class interval
(b) the class size of the corresponding class interval
(c) frequency of the corresponding class interval
(d) cumulative frequency of the corresponding class interval
Solution:
In histogram, the area of each rectangle is proportional to frequency of the corresponding class intervals.

Question 5.
In the ‘less than’ type of ogive the cumulative frequency is plotted against
(a) the lower limit of the concerned class interval
(b) the upper limit of the concerned class interval
(c) the mid-value of the concerned class interval
(d) any value of the concerned class interval
Solution:
In the ‘less than’ type of ogive cumulative frequency is plotted against the upper limit of the concerned class interval,

Question 6.
In a histogram the class intervals or the groups are taken along
(a) Y-axis
(b) X-axis
(c) both of X-axis and Y-axis
(d) in between X and Y axis
Solution:
In histogram, the class intervals or the groups are taken along X-axisA

Question 7.
A histogram is a pictorial representation of the grouped data in which class intervals and frequency are respectively taken along
(a) vertical axis and horizontal axis
(b) vertical axis only
(c) horizontal axis only
(d) horizontal axis and vertical axis
Solution:
A histogram is a pictorial representation of the grouped data in which class interval and frequency are respectively taken along horizontal axis and vertical axis.

Question 8.
In a histogram, each class rectangle is constructed with base as
(a) frequency
(b) class-intervals
(c) range
(d) size of the class
Solution:
In a histogram each class rectangle is constructed with base as class intervals.

Hope given RD Sharma Class 9 Solutions Chapter 23 Graphical Representation of Statistical Data MCQS are helpful to complete your math homework.

If you have any doubts, please comment below. Learn Insta try to provide online math tutoring for you.
RD Sharma Class 9 Solutions Chapter 23 Graphical Representation of Statistical Data Ex 23.3

RD Sharma Class 9 Solutions Chapter 23 Graphical Representation of Statistical Data Ex 23.3

These Solutions are part of RD Sharma Class 9 Solutions. Here we have given RD Sharma Class 9 Solutions Chapter 23 Graphical Representation of Statistical Data Ex 23.3

Other Exercises

Question 1.
Construct a histogram for the following data:
RD Sharma Class 9 Solutions Chapter 23 Graphical Representation of Statistical Data Ex 23.3 1.1
Solution:
RD Sharma Class 9 Solutions Chapter 23 Graphical Representation of Statistical Data Ex 23.3 1.2
Histogram is given below:
RD Sharma Class 9 Solutions Chapter 23 Graphical Representation of Statistical Data Ex 23.3 1.3

Question 2.
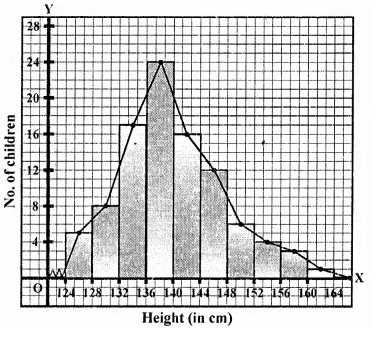
The distribution of heights (in cm) of 96 children is given below. Construct a histogram and a frequency polygon on the same axes.
RD Sharma Class 9 Solutions Chapter 23 Graphical Representation of Statistical Data Ex 23.3 2.1
Solution:
RD Sharma Class 9 Solutions Chapter 23 Graphical Representation of Statistical Data Ex 23.3 2.2
Histogram and frequency polygon is given here.
Draw midpoints Of each rectangle at the top and join them to get a frequency polygon.
RD Sharma Class 9 Solutions Chapter 23 Graphical Representation of Statistical Data Ex 23.3 2.3

Question 3.
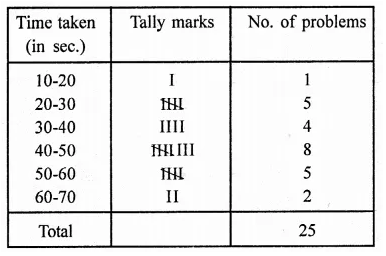
The time taken, in seconds, to solve a problem by each of 25 pupils is as follows:
16, 20, 26, 27, 28, 30, 33, 37, 38, 40, 42, 43, 46, 46, 46, 48, 49, 50, 53, 58, 59, 60, 64, 52, 20
(a) Construct a frequency distribution for these data, using a class interval of 10 seconds.
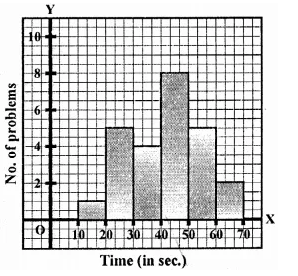
(b) Draw a histogram to represent the frequency distribution.
Solution:
Lowest observation = 16,
Highest observation = 64
RD Sharma Class 9 Solutions Chapter 23 Graphical Representation of Statistical Data Ex 23.3 3.1
Below is given the histogram
RD Sharma Class 9 Solutions Chapter 23 Graphical Representation of Statistical Data Ex 23.3 3.2

Question 4.
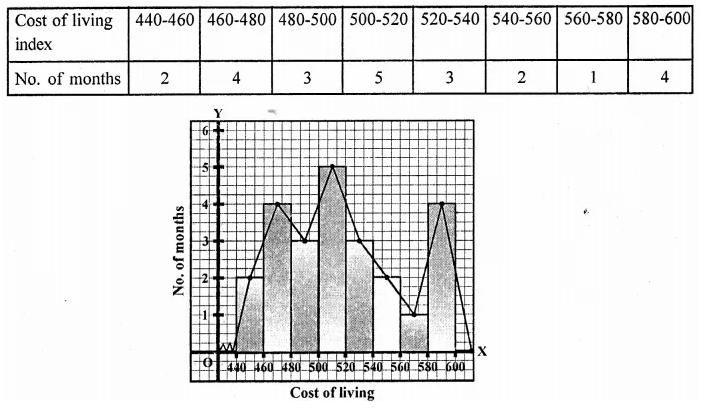
Draw, in the same diagram, a histogram and a frequency polygon to represent the following data which shows the monthly cost of living index of a city in a period of 2 years:
RD Sharma Class 9 Solutions Chapter 23 Graphical Representation of Statistical Data Ex 23.3 4.1
Solution:
RD Sharma Class 9 Solutions Chapter 23 Graphical Representation of Statistical Data Ex 23.3 4.2

Question 5.
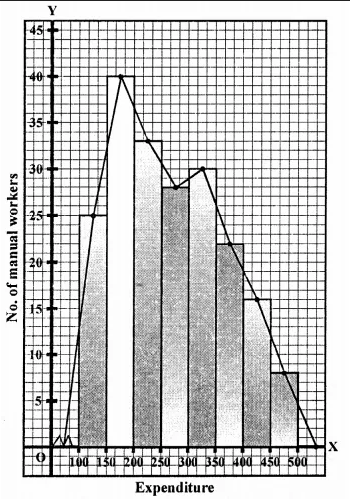
The following is the distribution of total household expenditure (in Rs.) of manual worker in a city:
RD Sharma Class 9 Solutions Chapter 23 Graphical Representation of Statistical Data Ex 23.3 5.1
Draw a histogram and a frequency polygon representing the above data.
Solution:
RD Sharma Class 9 Solutions Chapter 23 Graphical Representation of Statistical Data Ex 23.3 5.2
Here is given histogram and frequency polygon.
RD Sharma Class 9 Solutions Chapter 23 Graphical Representation of Statistical Data Ex 23.3 5.3

Question 6.
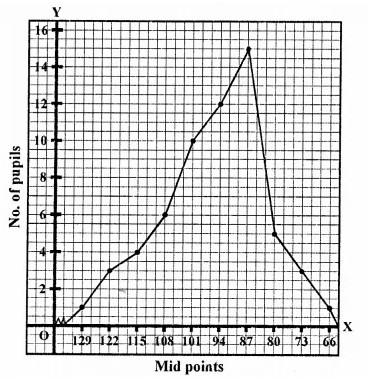
The following table gives the distribution of IQ’s (intelligence quotients) of 60 pupils of class V in a school:
RD Sharma Class 9 Solutions Chapter 23 Graphical Representation of Statistical Data Ex 23.3 6.1
Draw a frequency polygon for the above data.
Solution:
RD Sharma Class 9 Solutions Chapter 23 Graphical Representation of Statistical Data Ex 23.3 6.2
Now plot the (mid point, frequency) on the graph and join them to get a frequency polygon.
RD Sharma Class 9 Solutions Chapter 23 Graphical Representation of Statistical Data Ex 23.3 6.3

Question 7.
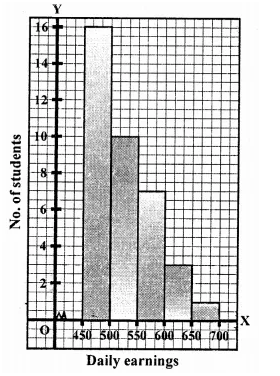
Draw a histogram for the daily earnings of 30 drug stores in the following table:
RD Sharma Class 9 Solutions Chapter 23 Graphical Representation of Statistical Data Ex 23.3 7.1
Solution:
RD Sharma Class 9 Solutions Chapter 23 Graphical Representation of Statistical Data Ex 23.3 7.2
Hisotgram is given below:
RD Sharma Class 9 Solutions Chapter 23 Graphical Representation of Statistical Data Ex 23.3 7.3

Question 8.
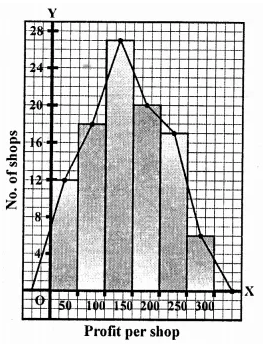
The monthly profits (in t) of 100 shops are distributed as follows:
RD Sharma Class 9 Solutions Chapter 23 Graphical Representation of Statistical Data Ex 23.3 8.1
Draw a histogram for the data and show the frequency polygon for it.
Solution:
RD Sharma Class 9 Solutions Chapter 23 Graphical Representation of Statistical Data Ex 23.3 8.2
Histogram and frequency polygon is given below:
RD Sharma Class 9 Solutions Chapter 23 Graphical Representation of Statistical Data Ex 23.3 8.3

Hope given RD Sharma Class 9 Solutions Chapter 23 Graphical Representation of Statistical Data Ex 23.3 are helpful to complete your math homework.

If you have any doubts, please comment below. Learn Insta try to provide online math tutoring for you.

RS Aggarwal Class 6 Solutions Chapter 1 Number System Ex 1C

RS Aggarwal Class 6 Solutions Chapter 1 Number System Ex 1C

These Solutions are part of RS Aggarwal Solutions Class 6. Here we have given RS Aggarwal Solutions Class 6 Chapter 1 Number System Ex 1C

Other Exercises

Question 1.
Solution:
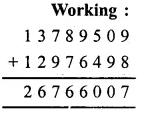
Number of persons in the first year = 13789509
Number of persons in the second year = 12976498
Total number of persons in the two years =13789509 +12976498
= 26766007 Ans.
RS Aggarwal Class 6 Solutions Chapter 1 Number System Ex 1C 1.1

Question 2.
Solution:
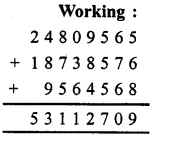
Number of sugar bags in the first factory = 24809565
Number of sugar bags in the second factory = 18738576
Number of sugar bags in the third factory = 9564568
Total number of sugar bags in the three factories
= 24809565 + 18738576 + 9564568
= 53112709 bags Ans.
RS Aggarwal Class 6 Solutions Chapter 1 Number System Ex 1C 2.1

Question 3.
Solution:
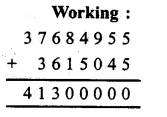
The given number = 37684955
The number which exceeds the given number by 3615045 will be
= 37684955 + 3615045
= 41300000 Ans.
RS Aggarwal Class 6 Solutions Chapter 1 Number System Ex 1C 3.1

Question 4.
Solution:
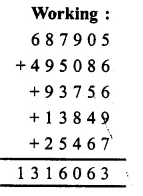
Number of votes received by the first candidate = 687905
Number of votes received by the second candidate = 495086
Number of votes received by the third candidate = 93756
Number of invalid votes = 13849
Number of persons who did not vote = 25467
Total number of registered votes = 687905 + 495086 + 93756 + 13849 + 25467
= 1316063 Ans.
RS Aggarwal Class 6 Solutions Chapter 1 Number System Ex 1C 4.1

Question 5.
Solution:
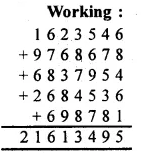
Number of people who got primary education = 1623546
Number of people who got secondary education = 9768678
Number of people who got higher education = 6837954
Number of illiterate people = 2684536
Number of children below the age of admission = 698781
Total population of the state = 1623546 + 9768678 + 6837954 + 2684536 + 698781
= 21613495 Ans.
RS Aggarwal Class 6 Solutions Chapter 1 Number System Ex 1C 5.1

Question 6.
Solution:
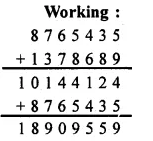
In the first year, number of cycles produced = 8765435
In the second year, number of cycles produced = 8765435 + 1378689
= 10144124
The number of bicycles produced in the two years = 8765435 + 10144124
= 18909559 Ans.
RS Aggarwal Class 6 Solutions Chapter 1 Number System Ex 1C 6.1

Question 7.
Solution:
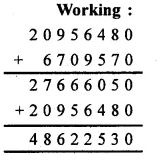
Sale receipt during first year = Rs. 20956480
Sale receipt during the second year = Rs. 20956480 + Rs. 6709570
= Rs. 27666050
Total sale receipt during the two years = Rs. 20956480 + Rs.27666050
= Rs. 48622530 Ans
RS Aggarwal Class 6 Solutions Chapter 1 Number System Ex 1C 7.1

Question 8.
Solution:
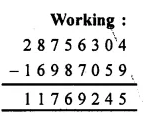
Total population of a city = 28756304
Number of males = 16987059
Number of females = 28756304 – 16987059
= 11769245 Ans.
RS Aggarwal Class 6 Solutions Chapter 1 Number System Ex 1C 8.1

Question 9.
Solution:
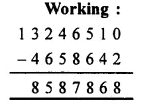
The number 13246510 is larger than 4658642
= 13246510 – 4658642
= 8587868 Ans.
RS Aggarwal Class 6 Solutions Chapter 1 Number System Ex 1C 9.1

Question 10.
Solution:
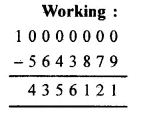
5643879 is smaller than one crore
= 10000000 – 5643879
= 4356121 Ans.
RS Aggarwal Class 6 Solutions Chapter 1 Number System Ex 1C 10.1

Question 11.
Solution:
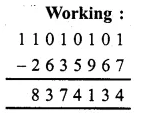
To, get the required number, we should subtract 2635967 from 11010101
= 11010101 – 2635967
= 8374134 Ans.
RS Aggarwal Class 6 Solutions Chapter 1 Number System Ex 1C 11.1

Question 12.
Solution:
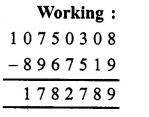
Sum of two numbers = 10750308
First number = 8967519
Second number = 10750308 – 8967519
= 1782789 Ans.
RS Aggarwal Class 6 Solutions Chapter 1 Number System Ex 1C 12.1

Question 13.
Solution:
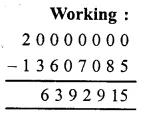
Total money, a man had = Rs 20000000
Amount spent on buying a school building = Rs. 13607085
Amount left with him
= Rs. 20000000 – Rs. 13607085
= Rs. 6392915 Ans.
RS Aggarwal Class 6 Solutions Chapter 1 Number System Ex 1C 13.1

Question 14.
Solution:
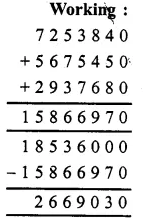
The total requirement of a society = Rs. 18536000
Amount of fee collection = Rs. 7253840
Amount of loan taken = Rs. 5675450
Amount of donation = Rs. 2937680
Total amount collected = Rs. 7253840 + Rs. 5675450 + Rs. 2937680
= Rs. 15866970
Short amount
= Rs. 18536000 – Rs. 15866970
= Rs. 2669030 Ans.
RS Aggarwal Class 6 Solutions Chapter 1 Number System Ex 1C 14.1

Question 15.
Solution:
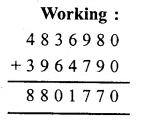
Total amount a man had = Rs. 10672540
Amount given to his wife = Rs. 4836980
Amount given to his son = Rs 3964790
Total amount given to wife and son = Rs. 4836980 + Rs 3964790
= Rs. 8801770
RS Aggarwal Class 6 Solutions Chapter 1 Number System Ex 1C 15.1
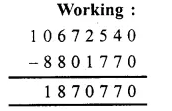
Balance amount given to his daughter
= Rs. 10672540 – Rs. 8801770
= Rs. 1870770 Ans.
RS Aggarwal Class 6 Solutions Chapter 1 Number System Ex 1C 15.2

Question 16.
Solution:
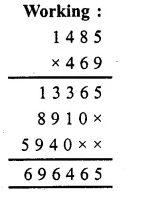
Cost of one chair = Rs. 1485
Cost of 469 chairs = Rs. 1485 x 469
= Rs. 696465 Ans.
RS Aggarwal Class 6 Solutions Chapter 1 Number System Ex 1C 16.1

Question 17.
Solution:
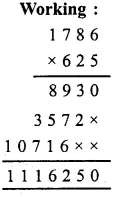
Collection from one student = Rs. 625
Collection from 1786 students = Rs. 1786 x 625
= Rs. 1116250 Ans.
RS Aggarwal Class 6 Solutions Chapter 1 Number System Ex 1C 17.1

Question 18.
Solution:
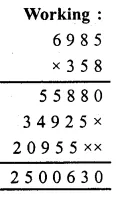
Number of screws produced in one day = 6985
Number of screws produced in 358 days = 6985 x 358
= 2500630 Ans.
RS Aggarwal Class 6 Solutions Chapter 1 Number System Ex 1C 18.1

Question 19.
Solution:
Number of months in one year = 12
Number of months in 13, years = 12 x 13
= 156
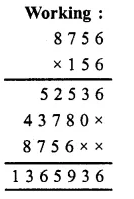
months Saving in one month = Rs. 8756
Saving in 156 months = Rs. 8756 x 156
= Rs. 1365936 Ans.
RS Aggarwal Class 6 Solutions Chapter 1 Number System Ex 1C 19.1

Question 20.
Solution:
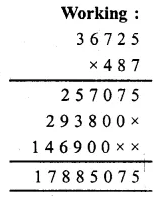
Cost of 1 scooter = Rs. 36725
Cost of 487 scooters = Rs. 36725 x 487
= Rs. 17885075 Ans.
RS Aggarwal Class 6 Solutions Chapter 1 Number System Ex 1C 20.1

Question 21.
Solution:
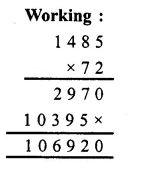
Distance covered in 1 hour = 1485 km
Distance covered in 72 hours = 1485 x 72 km
= 106920 km Ans.
RS Aggarwal Class 6 Solutions Chapter 1 Number System Ex 1C 21.1

Question 22.
Solution:
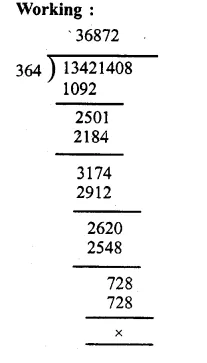
Product of two numbers = 13421408
First number = 364
Second number = 13421408 ÷ 364
= 36872 Ans.
RS Aggarwal Class 6 Solutions Chapter 1 Number System Ex 1C 22.1

Question 23.
Solution:
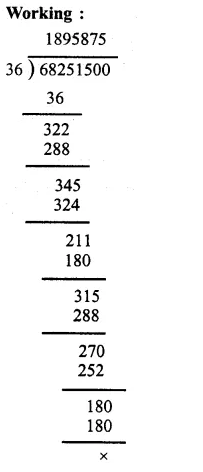
Cost of 36 flats = Rs. 68251500
Cost of one flat
= Rs. 68251500 ÷ 36
= Rs. 1895875 Ans.
RS Aggarwal Class 6 Solutions Chapter 1 Number System Ex 1C 23.1

Question 24.
Solution:
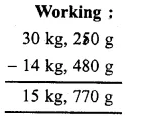
Mass of cylinder with gas = 30 kg 250 g and mass of empty cylinder = 14 kg 480 g
Mass of gas = 30 kg, 250 g – 14 kg, 480 g
= 15 kg, 770 g Ans.
RS Aggarwal Class 6 Solutions Chapter 1 Number System Ex 1C 24.1

Question 25.
Solution:
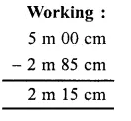
Total length of cloth = 5 m
Length of piece cut off = 2 m 85 cm
Length of remaining piece of cloth = 5 m – 2 m 85 cm
= 2 m 15 cm Ans.
RS Aggarwal Class 6 Solutions Chapter 1 Number System Ex 1C 25.1

Question 26.
Solution:
Cloth required for 1 shirt = 2 m 75 cm
Cloth required for 16 shirts = 2 m 75 cm x 16
= 44 m Ans.

Question 27.
Solution:
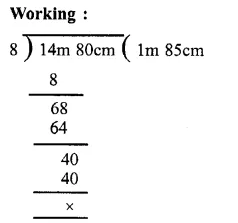
Total length of cloth for 8 trousers = 14 m 80 cm
Length of cloth for 1 trouser = 14 m 80 cm ÷ 8
= 1 m 85 cm Ans.
RS Aggarwal Class 6 Solutions Chapter 1 Number System Ex 1C 27.1

Question 28.
Solution:
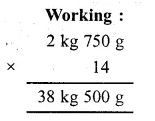
Mass of 1 brick = 2 kg 750 g
Total mass of 14 bricks = 2 kg 750 g x 14
= 38 kg 500 g Ans.
RS Aggarwal Class 6 Solutions Chapter 1 Number System Ex 1C 28.1

Question 29.
Solution:
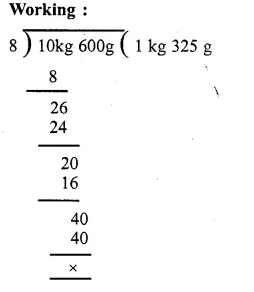
Total mass of 8 packets = 10 kg 600 g
Mass of one packet = 10 kg 600 ÷ 8
= 1 kg 325 g Ans.
RS Aggarwal Class 6 Solutions Chapter 1 Number System Ex 1C 29.1

Question 30.
Solution:
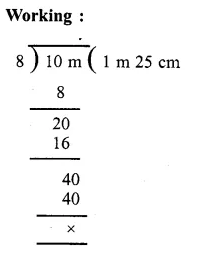
Total length of rope = 10 m
No of pieces = 8
Length of each piece = 10 m ÷ 8
= 1 m 25 cm Ans.
RS Aggarwal Class 6 Solutions Chapter 1 Number System Ex 1C 30.1

Hope given RS Aggarwal Solutions Class 6 Chapter 1 Number System Ex 1C are helpful to complete your math homework.

If you have any doubts, please comment below. Learn Insta try to provide online math tutoring for you.